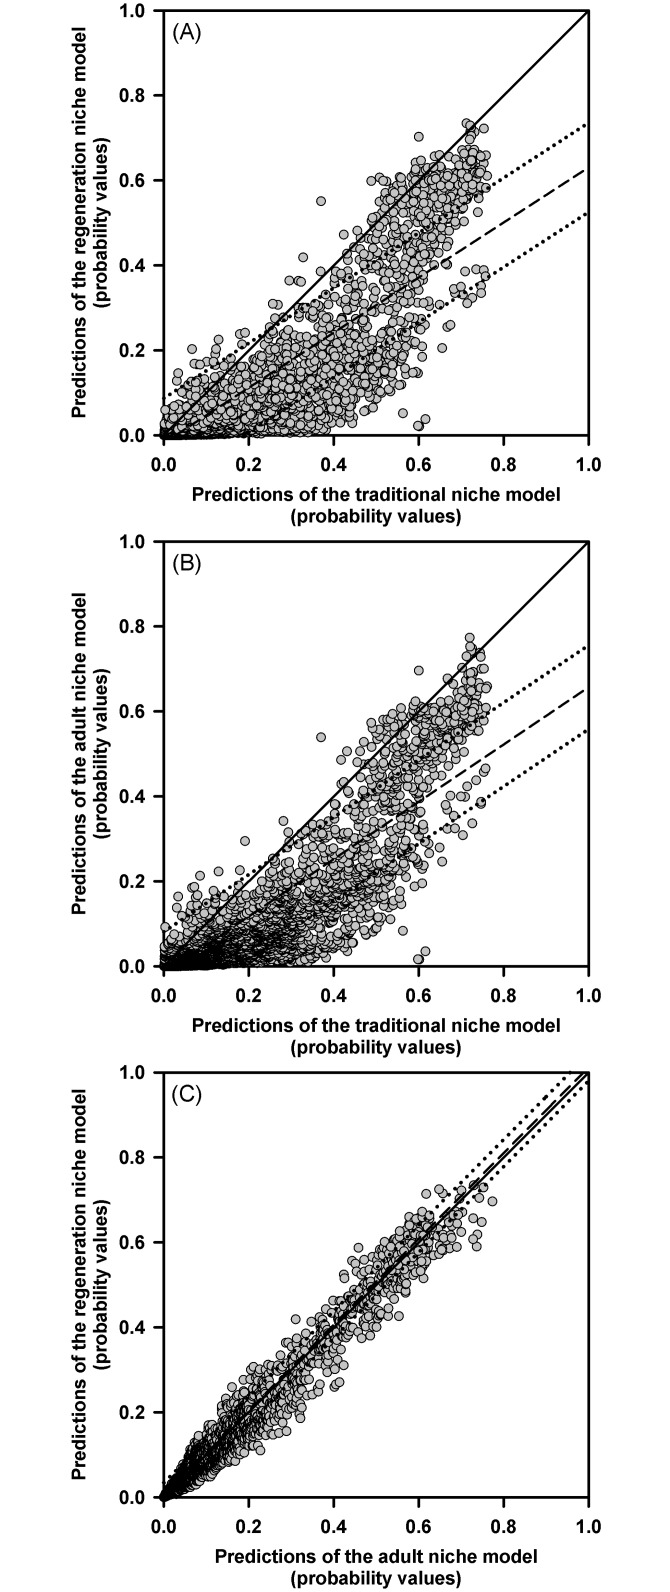
Fig 2.
Relationships obtained from comparing predictions of the generalized niche model against predictions of the regeneration niche model (A) and predictions of the adult niche model (B). The figure also shows the relationship obtained by comparing the predictions of the adult and the regeneration niche models (C). Each panel shows the theoretical regression curve expected for perfect matching between predictions of models (solid line) and the empirical curves obtained from the regression analyses (dashed lines) with their 95% prediction intervals (dotted lines).

