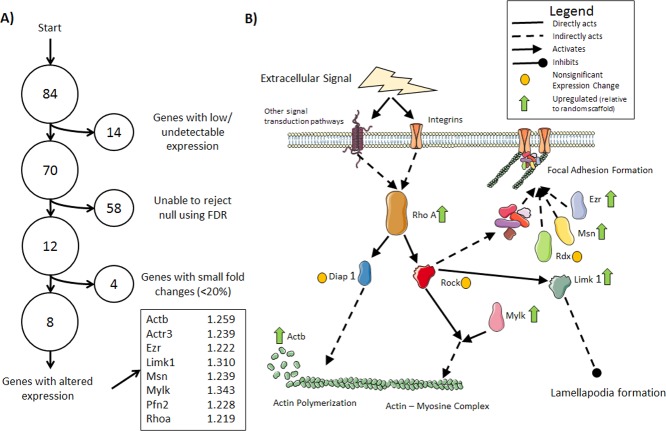
Fig 6. Gene Expression Microarray Results.
A) A diagram showing the process for identifying genes with altered expression: the false discovery rate (FDR) was calculated using BH method to limit the FDR to at most 2 expected false positive results in the all rejected null hypotheses (FDR = 16.6%). These results were further limited to genes with the largest fold changes (fold change > 20%). The identified genes are listed along with their fold changes relative to randomly oriented scaffolds. B) Pathway diagram illustrating where the protein products of several of the identified genes work to promote actin production and polymerization and focal adhesion assembly.

