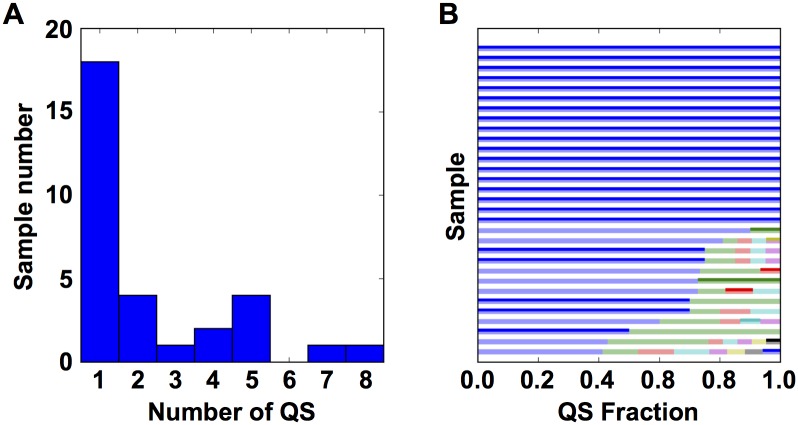
Fig 1. Direct sequencing of PCR products generated directly from genomic DNA very often returns the predominant genotype.
(A) (Left) A histogram of the number of QS observed in each of the 31 samples with at least 10 Clone Reads. (B) A bar plot showing the fraction of the total observed QS for each unique Clone Read. Each horizontal bar represents one of the 31 samples with the width of the bar indicating the QS fraction. Each color in the bar indicates unique QS. Darker bars denote the QS that match the PCR Read.

