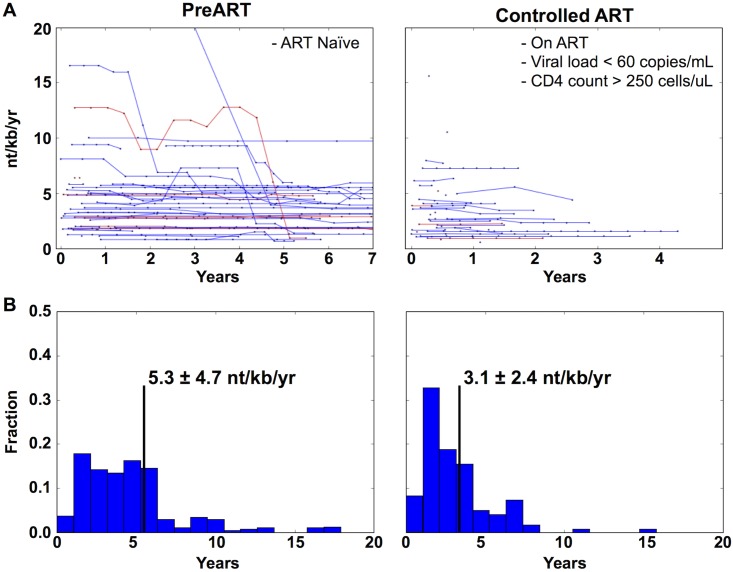
Fig 3. The mutation rate of HIV-1 is lowered by the introduction of ART but not to undetectable levels.
(A) The time series of mutation rates for all patients (N = 36) that fall into the PreART Group and Suppressed ART Group. Red lines represent the mutation rate of tat exon I, while blue lines represent the LTR mutation rate. In order to synchronize each patient, their time points were aligned such that all patients in the PreART Group had their t = 0 set to their estimated time of infection. Patients in the Suppressed ART Group were synchronized such that t = 0 was set to the first clinical visit in which their viral loads dropped to undetectable levels and continued until either they switched therapy, lost viral control, or the current time was reached. (B) A normalized histogram of the mean mutation rate for each patient in either the PreART or Suppressed ART Group categories is shown. The black vertical line denotes the average rate.

