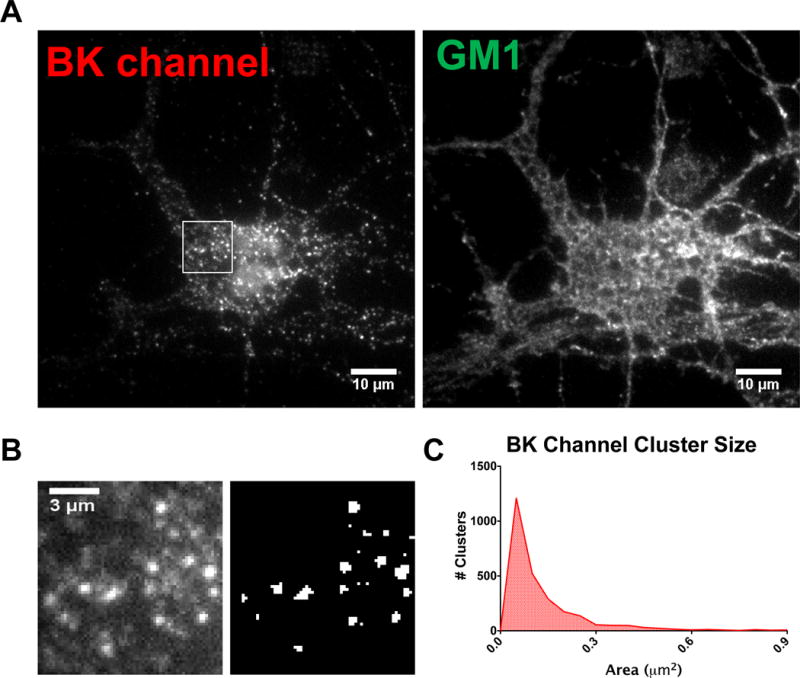
Figure 1.

TIRF imaging of BK channels in hippocampal neurons. Representative TIRF images showing BK perimembrane expression in clusters and diffuse localization in hippocampal neurons. (A) Left: TIRF imaging of endogenous BK channels after immunofluorescence, right: GM1 staining showing the outline of the neuron. (B) Measurements of clusters. Left: higher magnification view of the boxed area in (A). Note the bright puncta (clusters) and diffuse staining, Right: binary image showing thresholding used for measuring clusters. (C) Histogram showing the size distribution of BK channel clusters (2618 clusters were quantified from 134 neurons).
