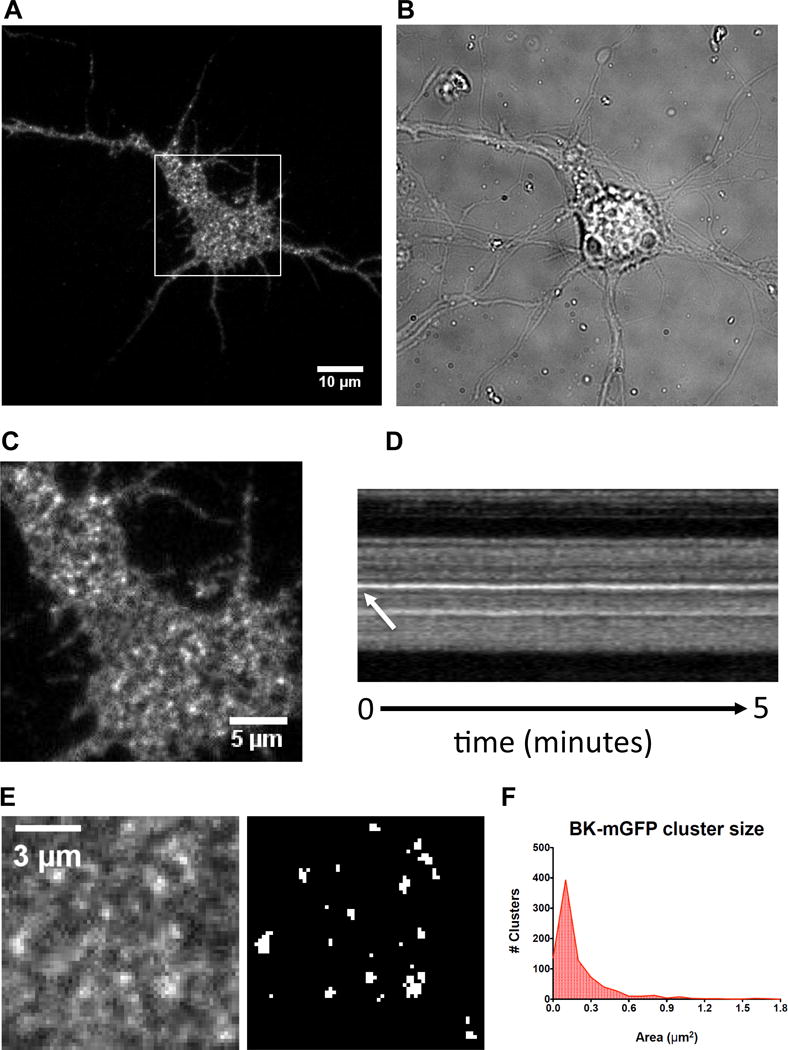
Figure 2.

Live cell imaging of BK-mGFP shows a similar distribution than endogenous BK channel in hippocampal neurons. Hippocampal neurons were transfected with a BK-mGFP construct. (A) Left: Transfected neuron shows GFP fluorescence in the cell body and processes. Right: Brightfield image of BK-mGFP-expressing neuron. (B) A higher magnification view of the boxed region in image A. The neuronal soma expressing BK-mGFP clearly shows a diffuse population and an aggregated bright puncta population similar to the endogenous staining of the BK channel. (C) Kymograph of bright puncta circled in image (B) which did not exhibit movement during the 5-minute long time-lapse. The time-lapse has an interval of 3 seconds between frames. (D) Measurements of clusters. Left: higher magnification view of image (B). Note the bright puncta (clusters) and diffuse staining, Right: binary image showing thresholding used for measuring clusters. (E) Histogram showing the size distribution of BK-mGFP channel clusters expressed in hippocampal neurons (858 clusters were quantified from 24 neurons).
