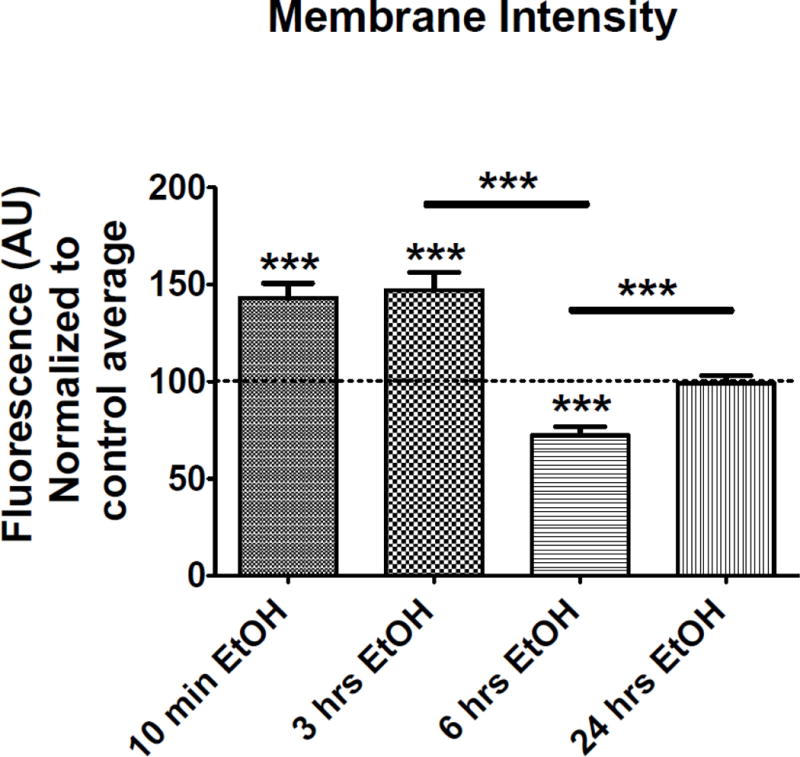
Figure 3.

Membrane intensity changes after time-dependent incubations with EtOH. Hippocampal neurons were incubated with EtOH for 10-min (control N=46, EtOH N=50 neurons), 3-hrs (control N=53, EtOH N=50 neurons), 6-hrs (control N=35, EtOH N=35 neurons) and 24-hrs (control N=47, EtOH N=48 neurons) and fixed and stained immediately afterwards. The graph shows the quantification of BK fluorescence intensity in the cell body after TIRF imaging. Values are shown as normalized fluorescence to the control group. P < 0.001, unpaired t-test to its own control group. Black lines with stars positioned over the columns show significant differences between EtOH treated groups, P < 0.001, one-way ANOVA followed by Bonferroni post hoc. Error bar is ±SEM.
