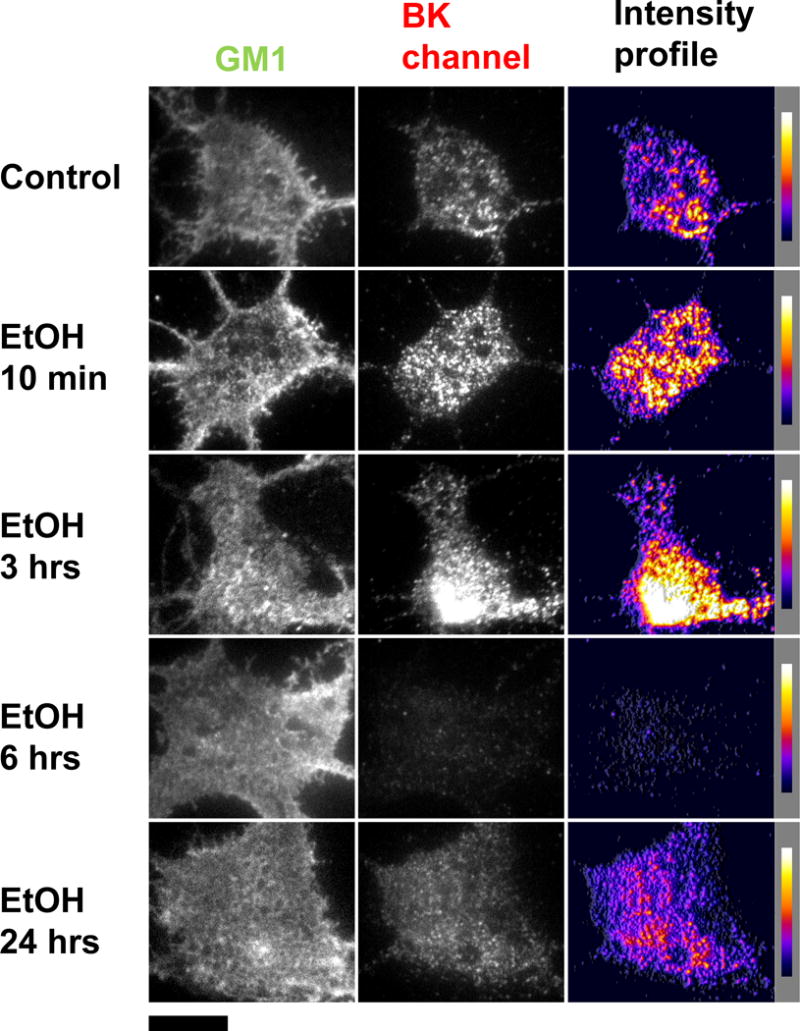
Figure 4.

Representative TIRF images showing time-dependent changes in BK perimembrane expression. Hippocampal neurons were incubated with EtOH for 10-min, 3-hrs, 6-hrs and 24-hrs and fixed and stained immediately afterwards. The left column shows the outline of the neurons via a membrane stain against GM1 (in the green channel). The center column shows representative TIRF images of hippocampal neurons after immunofluorescence against the BK channel (in the red channel). The right column shows pseudo-colored intensity profile displaying areas with higher fluorescence as yellow/white and with lower fluorescent signal as purple/black. All image are shown under the same parameters. Each row corresponds to a treatment. Scale bar = 10μm.
