
Figure 5.
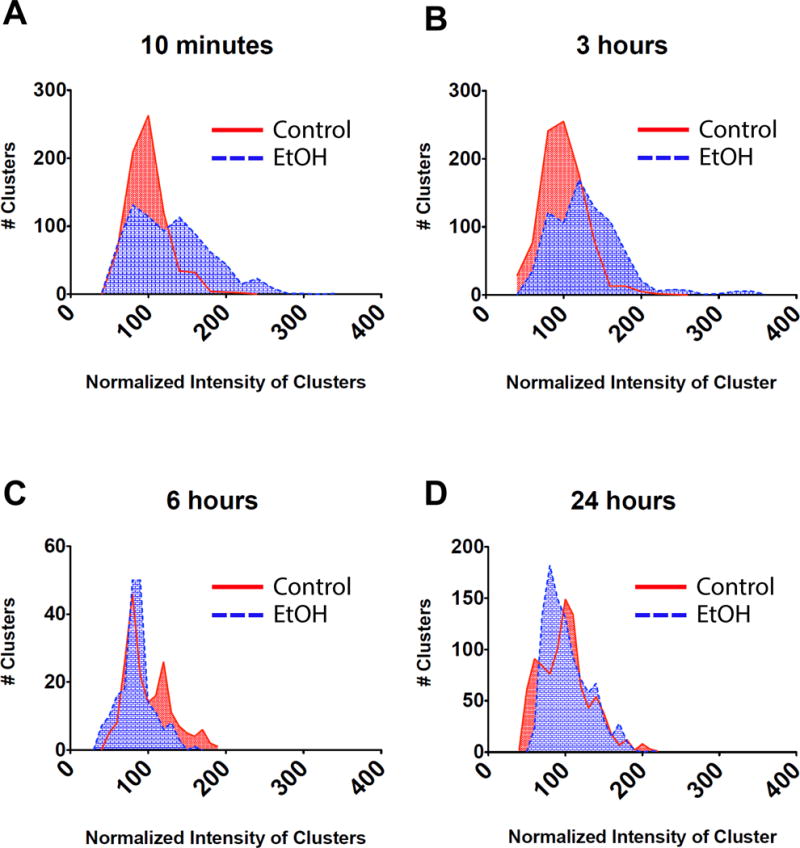
Cluster intensity changes after time-dependent incubations with EtOH. Hippocampal neurons were incubated with EtOH for 10-min, 3-hrs, 6-hrs or 24-hrs, and fixed and stained immediately against BK channel afterwards. Intensity of the clusters was quantified from TIRF images and values were pooled from many cells. Histograms showing changes in the distribution of the cluster fluorescence intensity after time-dependent EtOH incubations. Fluorescence intensity is shown as normalized values. Red (continuous line) is the size distribution of clusters in control cells and the blue (dashed line) is for the size distribution of clusters in EtOH treated cells. Note the shifts to the right meaning an increase in fluorescence intensity and shifts to the left indicating a reduction in fluorescence intensity. (A) 10-min EtOH (B) 3-hrs EtOH (C) 6-hrs EtOH (D) 24-hrs EtOH. Statistics between each control and EtOH pair showed that there is a significant effect after 10-min (control=732 clusters quantified from 46 neurons, EtOH=770 clusters quantified from 50 neurons), 3-hrs (control=890 clusters quantified from 53 neurons, EtOH=787 clusters quantified from 50 neurons), and 6-hrs (control=199 clusters quantified from 15 neurons, EtOH=194 clusters quantified from 16 neurons), of EtOH exposure (p < 0.0001, unpaired t-test), but not after 24-hrs (control=947 clusters quantified from 47 neurons, EtOH=996 clusters quantified from 48 neurons) of EtOH exposure (p >0.05, unpaired t-test).