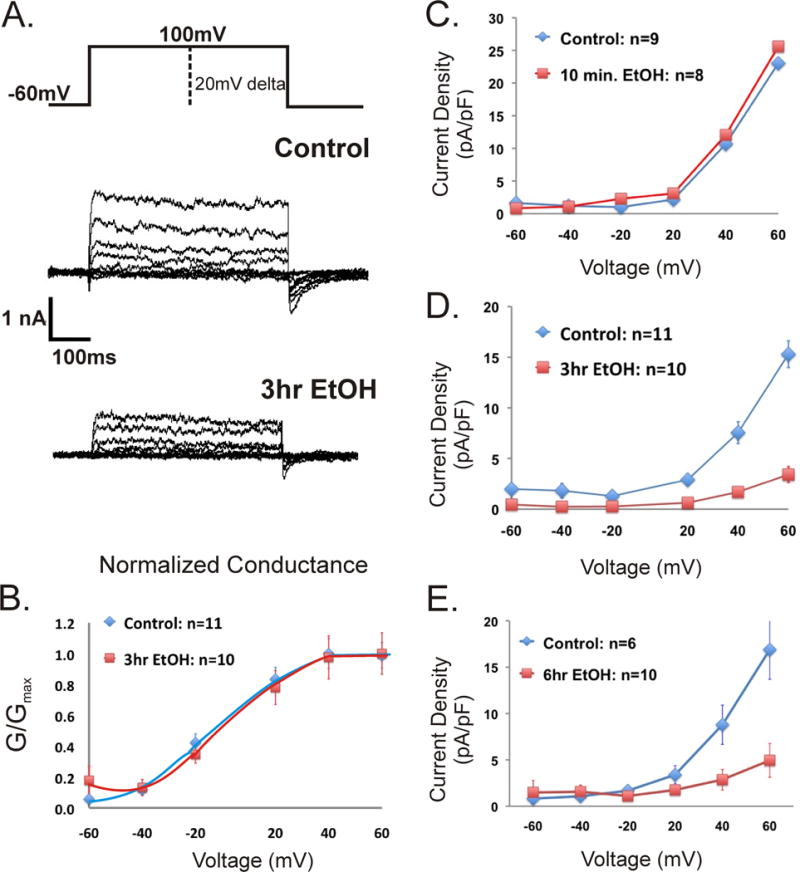
Figure 7.

Changes in current density in response to EtOH exposure are time-dependent. (A) Representative macroscopic currents for untreated control and 3-hr EtOH treated hippocampal primary neurons obtained using the whole-cell configuration of the voltage-clamp technique. The neurons were held at hp=−60 mV, voltage steps were delta 20 mV to a final voltage of 100 mV. (B) Graph shows the normalized conductance of neurons with and without EtOH for 3-hrs. The V 1/2 for the untreated control was (−3.84 ± 3.53) mV; n=11, which was not statistically different from the EtOH 3-hrs V 1/2 (2.429 ± 2.74) mV; n=10 (p > 0.42, t-test). Normalized conductance was also measured for the 10-min and 6-hr treatments with a V 1/2 not significantly different from control (data not shown). Current density measurements obtained for 10-min (C), 3-hr (D), and 6-hr (E) 25mM EtOH exposure were obtained for voltages starting from −60 to 60 mV. Single channel conductance of the channel did not change, suggesting that the decrease in current density corresponds to a diminished number of functional channels in the plasma membrane. Error bars represent SEM, when not visible, they are contained within the point marker.
