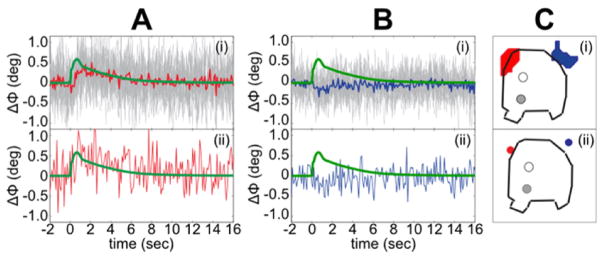
Fig. 12.
Single-voxel detection of the ΔΦ. A(i) and B(i) show superimposed single-voxel ΔΦ time courses in all the voxels in the red and blue ROIs in C(i), respectively. Averaged across the 160 trials. Red and blue time courses in A(i) and in B(i)—average of all the single-voxel time courses in the red and blue regions in C(i). Concurrently recorded LFP shown in green. A(ii) and B(ii) show single-voxel ΔΦ time courses in the red and blue voxels labeled in C(ii). ROI in C(i) was selected from a single animal. In C(i–ii), the solid dots show location of the stimulating electrodes while the open dots show location of the recording electrodes.

