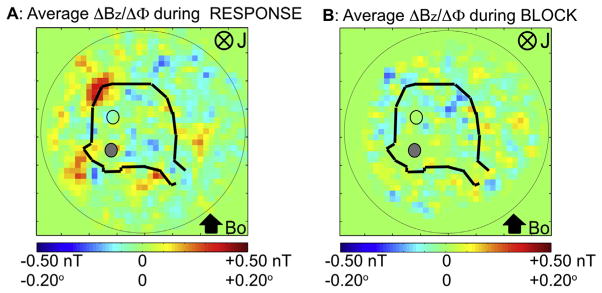
Fig. 13.
Spatial map of ΔΦ during (A) the RESPONSE condition and during the same time window during (B) the BLOCK. Average phase change maps are over n = 5 animals. Phase changes seen in the RESPONSE are not visible in the BLOCK condition. In both A, B, the solid dots are the stimulating electrodes and the open dots are the recording electrodes, respectively.

