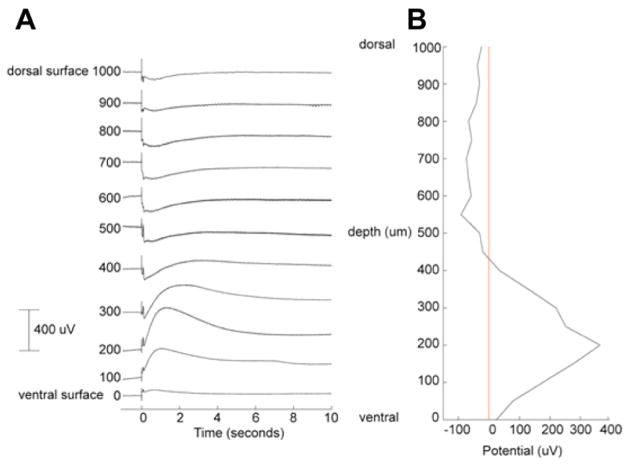
Fig. 5.
Laminar extracellular potential profile along the depth of the cerebellum at a single location ipsilateral to the stimulation. (A) Measured LFPs at 100 μm increments. (B) Depth profile at the peak of the LFP. The profile suggests an extracellular current source in the granular layer and an extracellular current sink in the molecular layer and in the Purkinje cell layer. Measurement made using a glass micropipette outside the MRI in a magnetically shielded room.

