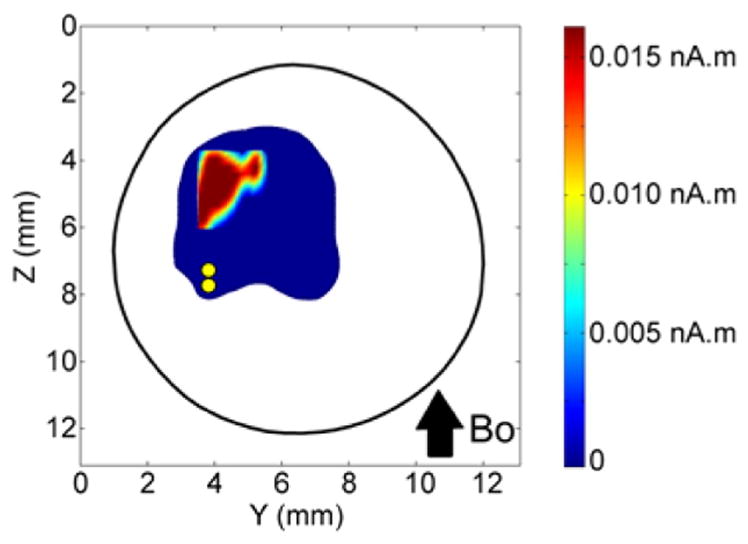
Fig. 9.

Distribution of current dipole moment (nA.m) based on the 250 μV isopotential contour in the map in Fig. 6B. Dipoles were located in the middle layer of the cerebellum in a 0.125 × 0.125 mm grid. At each grid location in the active area, a single current dipole was placed (pointing into plane of the image). The maximal current dipole moment was 0.0156 nA.m corresponding to a peak current dipole moment density of 1 nA.m/mm2 assumed in this calculation. The pair of yellow dots shows location of the twisted pair of stimulating electrodes.
