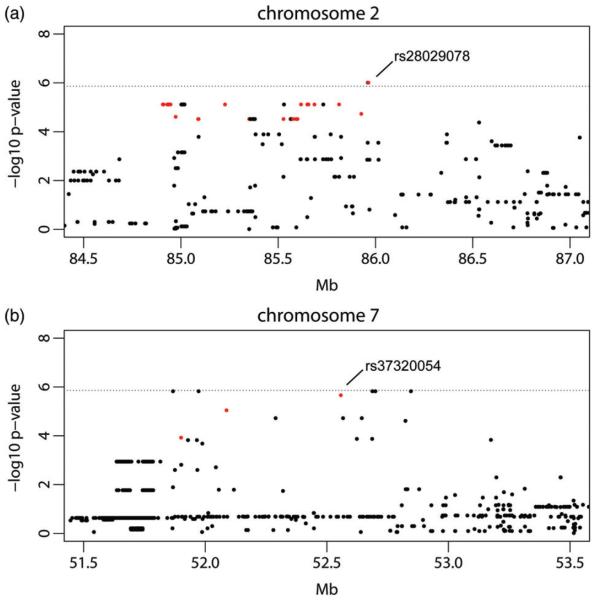
Figure 3. Region plots showing fine-mapped genetic loci for PPI.
Regions were identified on Chromosome 2 (a) and Chromosome 7 (b). Red SNPs are eQTL in hippocampus and striatum (see Table 1 and Table S2). A higher density panel of SNPs with imputed genotypes was used to further evaluate support for association at the loci identified in the genome-wide scan. Both initial and replication cohort data were used for fine-mapping (N = 604). The dotted line gives the α= 0.05 significance threshold after applying Bonferroni correction.

