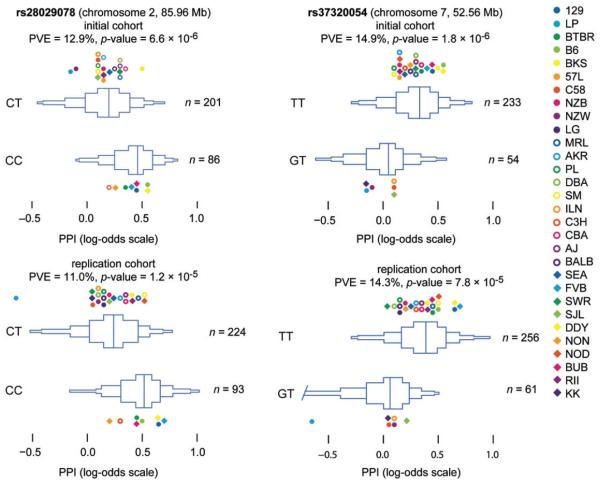
Figure 4. Distribution of (logit-transformed) PPI in F1 crosses.
Data from the initial (a) and replication (b) cohorts, stratified by genotype for SNP rs28029078 (left-hand panels) and SNP rs37320054 (right-hand panels). Box-percentile plots show the distribution of PPI across all the individual F1 samples. Dots give strain means over genetically identical F1 crosses, colored by strain. Proportion of variance explained (PVE) by genotype is estimated for each SNP after removing linear effects of covariates on phenotype.

