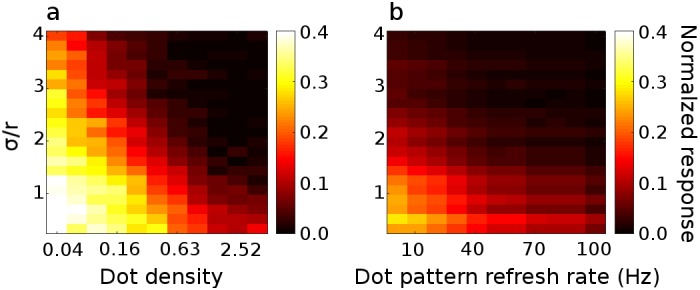
Fig 4. Effect of dot density, dot pattern refresh rate and relative receptive field size on disparity tuning in a model cell.

a) Normalized half-matched response (Eq 1) as a function of density and relative receptive field size (density is here defined as the equivalent proportion of space the dots would occupy if they did not occlude one another). A relative receptive field size of 2 means that σ/r = 2, i.e. that the standard deviation of the monocular Gabor is twice the dot radius. Colors show the magnitude of the normalized response. A normalized response of 1 would indicate that the response to half-matched stimuli at the preferred disparity is equal to the correlated response; a normalized response of 0 means that the half-matched response is equal to the uncorrelated response. Decreasing the relative receptive field size and reducing the dot density both increase the variability in the correlation level and thus increase the half-matched response. The normalized responses were obtained by computing the average half-matched, correlated, and uncorrelated responses from 20 000 RDS per density-relative RF size combination. b) Normalized half-matched response as a function of dot pattern refresh rate and relative receptive field size. Decreasing the relative receptive field size again increases the half-matched response. Similarly, increasing the dot pattern refresh rate decreases the variability in binocular correlation and thus decreases the half-matched disparity tuning. The normalized responses were obtained by averaging across 5000 trials, 10 seconds in duration, for each frequency-relative RF size combination.
