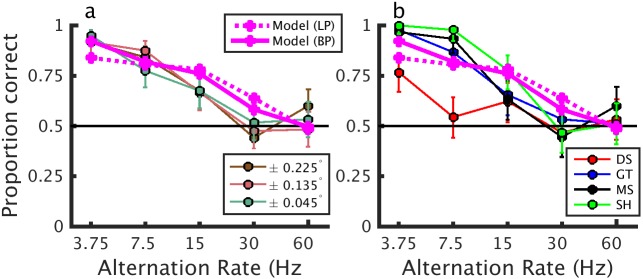
Fig 9. Psychophysical performance to alternating-correlation stereograms.
Performance of human observers on a front-back discrimination task with alternating-correlation random dot stereograms. a) Each line shows the averaged performance of all subjects for each disparity magnitude. b) Each line shows the performance of an individual observer averaged across the three disparities. The solid magenta line in each plot shows model performance with our band-pass temporal kernel [Model (BP)], and the magenta dotted line shows the model performance with the low-pass temporal kernel used in Doi et al [15] [Model (LP)]. In both cases, the model was shown a disparity of ±0.03°, and noise was fitted to match human observers.

