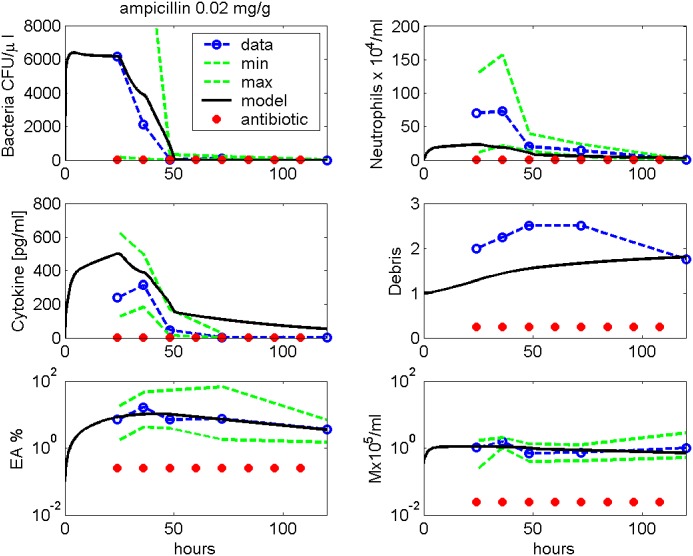
Fig 7. Ampicillin treatment.
We compare results of model simulation with data from [9] under Ampicillin treatment. Therapy starts 24 hours after infection and is continued every 12h. Time series of pneumococcal population, neutrophils, IL-6, debris, EU, EA and macrophages in BALF are displayed. Solid black curve represents simulation results. Circles represent data points. The green dashed lines represent minimal and maximal observed values.

