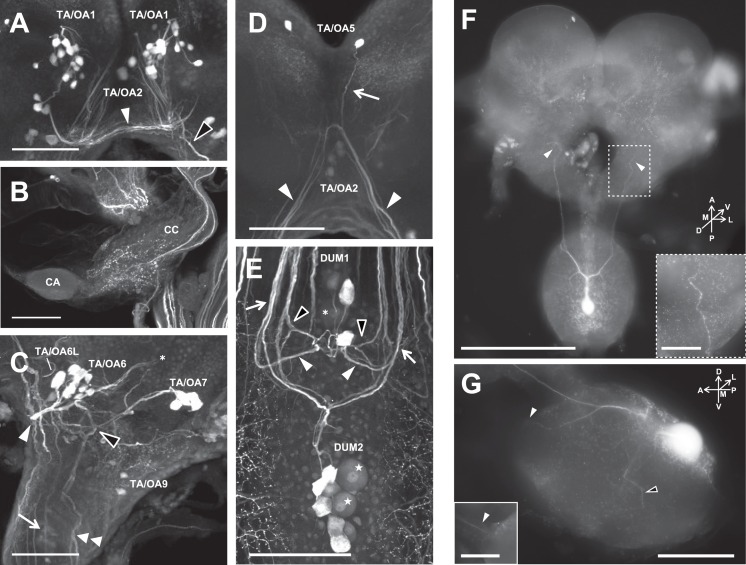
Fig 3. Projection pattern of TA-l-ir neurons.
(A~E) Immunostaining using an anti-TA antibody identified single neurons or clusters of immunostained neurons and their fibers. (A) TA/OA1 cluster forms the commissure under the central complex. (B) The corpora cardiaca (CC) is innervated by TA/OA3. Corpora allata (CA). (C) TA/OA6 and TA/OA7 show characteristic projection patterns. (D) TA/OA2 and TA/OA5 share the descending bundle. (E) In the SOG, DUM1 and DUM2 clusters show symmetrical projection patterns with different staining intensities. Scale bars indicate 100 μm. (F, G) Projection pattern of a DUM2-L neuron visualized by intracellular staining. DUM2-L neurons projected mainly into the mandibular nerves and tritocerebrum, and send thin neurites into the maxillary segment of the SOG. (F) Dorsal view of a DUM2-L neuron. Numerous varicosities were observed in the tritocerebrum (arrowheads). Inset indicates the magnified image of the DUM2-L projection area in tritocerebrum. Scale bars indicate 500μm in main picture, and 100μm in insets. (G) Lateral view of a DUM2-L neuron in the SOG. The neurite extends to the mandibular nerve (white arrowheads) and maxillary neuromere (a black arrowhead). Inset is the image of the different depthplane, indicating the DUM2-L projection into the mandibular nerve. Scale bars indicate 200μm in main picture, and 100μm in insets.

