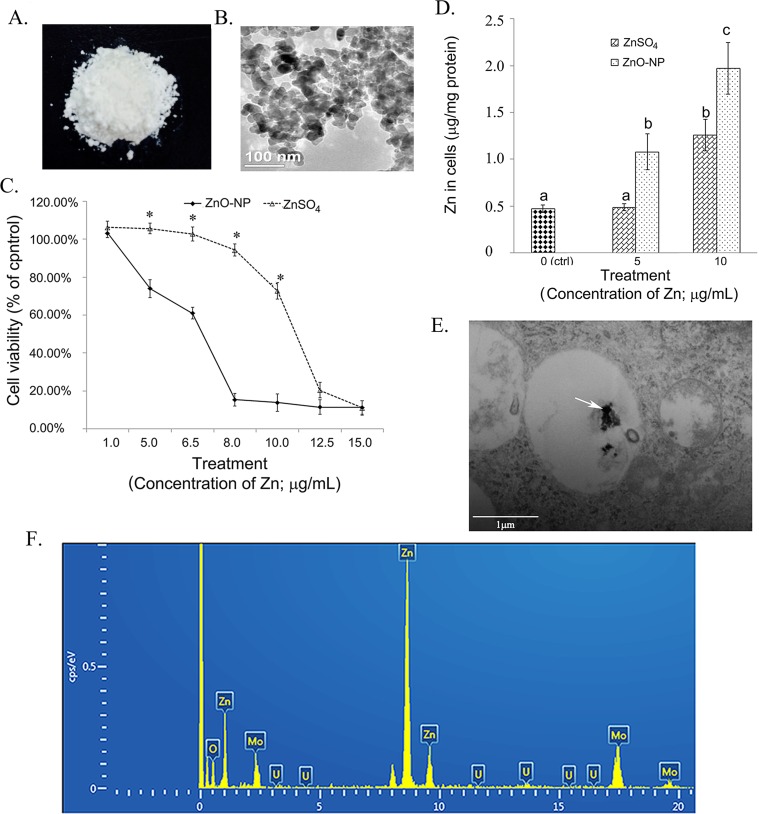
Fig 1. Effects of ZnO NPs on cell growth and intracellular concentration of Zn.
A. Photo of ZnO NPs; B. TEM image of ZnO NPs. C. Effects of ZnO NP and ZnSO4 on GCs growth, * p<0.05; D. Concentration of Zn in ZnO NPs and ZnSO4 treated GCs, a,b,c, same letter meant no difference, different letters indicated the difference between groups, p<0.05; E. TEM image of ZnO NPs in GCs indicated by the white arrow. F. EDS picture of ZnO NPs in GCs, where three Zn peaks shown.

