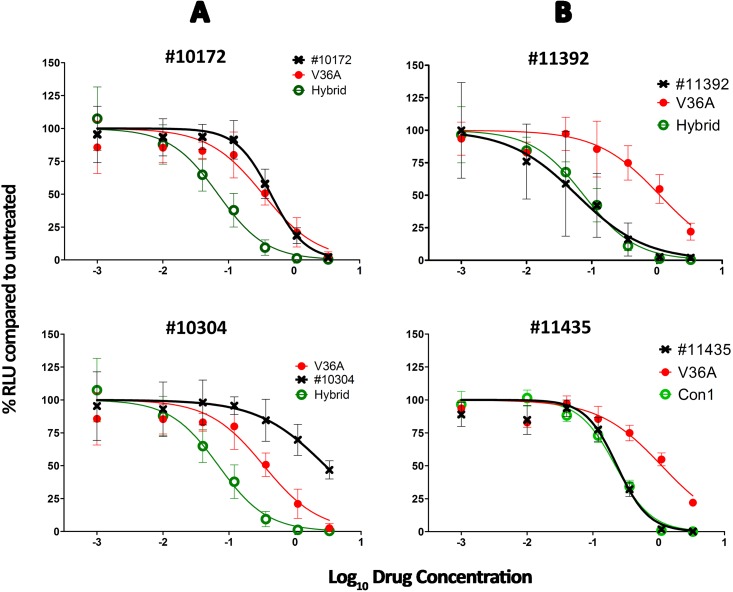
Fig 2. Examples of phenotypic measurements of PI susceptibility.
The curves in green correspond to the susceptible controls (Hybrid /Con1), those in red to the resistant construct 36A, and the black ones to the specific sample. A) Samples #10172 and 10304 are resistant to BOC; B) Samples #10172 and 10304 are susceptible to TVR.

