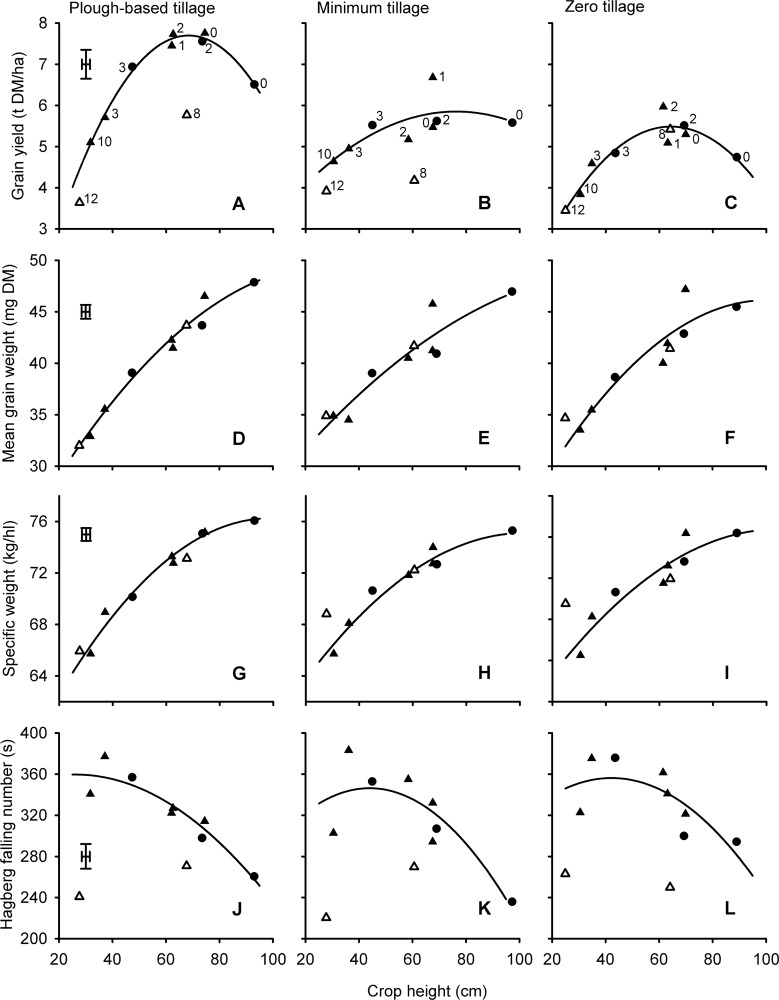
Fig 3. Rht and tillage effects on yield and quality of wheat related to crop height.
Numbers in panels A-C correspond to Rht- alleles (0 = tall, 1 = B1b, 2 = D1b, 3 = B1c, 8 = Rht8 + Ppd-D1a, 10 = D1c, 12 = Rht12) in Mercia (▲, △), and Maris Widgeon (●) backgrounds. Fits are quadratic. Open symbols (8 = Rht8 + Ppd-D1a, 12 = Rht12) are gibberellin-sensitive dwarfing alleles and not included in the fits. Alleles in all other panels can be inferred from labelling in panels A-C as heights of alleles are consistent. Main effects of background on the fitted constant have been removed from all data points. Points are means from 3 blocks in each of two years. Error bars are one standard error of difference for comparing alleles within tillage treatment (54 D.F.).

