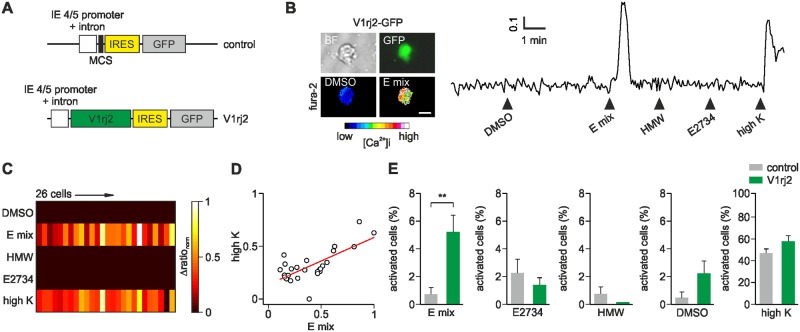
Fig 3. Functional overexpression of V1rj2 in HSV-infected VSNs.
(A) Diagram of the HSV-1 expression cassettes. In control amplicons GFP is expressed under the HSV-1 IE4/5 promoter, whereas in V1rj2 amplicons V1rj2 cDNA is inserted in the multi cloning site (MCS) upstream of IRES and GFP. (B) Bright field (BF), GFP and pseudocolor fura-2 images of a representative VSN infected with HSV-V1rj2-IRES-GFP and activated by the mix of four sulfated estrogens (E mix). Time course of intracellular calcium is shown on the right. Stimulations were 30 s long. Scale bar, 10 μm. (C) Color-coded heat map of normalized Δratio responses (Δrationorm) from 26 GFP+ VSNs infected with V1rj2-IRES-GFP which showed responses to the estrogen mix (E mix). These cells lacked responses to other stimuli except for high K+. (D) Comparison of response amplitudes expressed as normalized Δratio responses to E mix and high K of 26 individual cells shown in C. Each neuron is shown as a separate circle. Red line represents linear fit (slope = 0.55). Responses to E mix and high K+ are not significantly different (p = 0.92, Mann-Whitney test). (E) Summary of GFP+ cell activation for every stimulus on VSNs infected either with V1rj2-GFP (green) or with GFP control amplicons (grey). Values are expressed as percentage (%) of activated cells from the total of GFP+ cells. VSNs expressing V1rj2-GFP show increased cell responsivity to E mix (p < 0.005) but not to E2734, HMW, DMSO or high K+ (p = 0.1–0.4, Student’s t test). Responses to DMSO, E2734 or HMW did not overlap with responses to E-mix. N = 436 V1rj2-GFP cells and 563 control-GFP cells, in 8 and 16 experiments, respectively.

