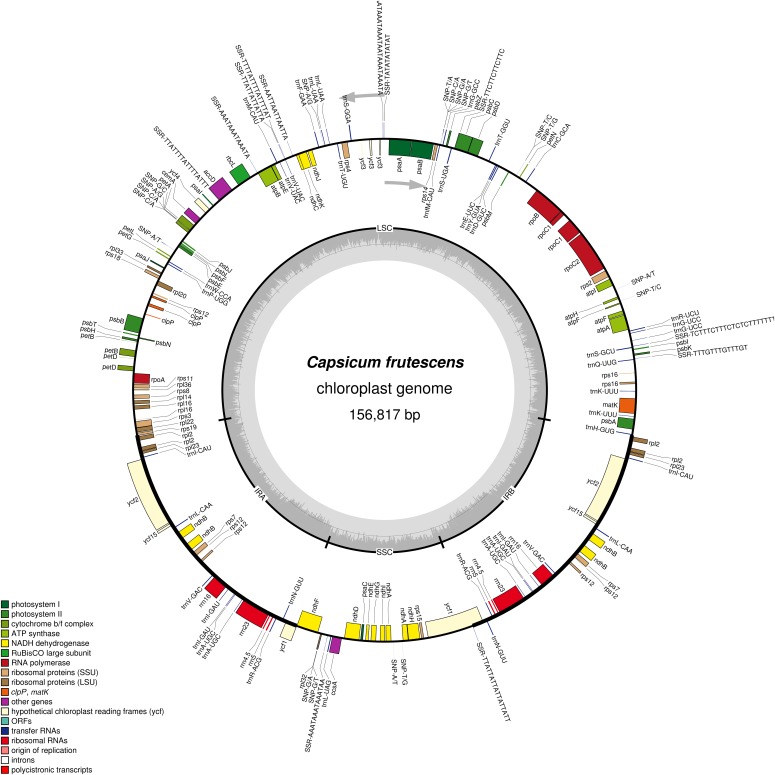
Fig. 1.
Gene map of the Capsicum frutescens chloroplast genome. Genes drawn inside the circle are transcribed clockwise, while those drawn outside are transcribed counterclockwise (marked with two arrows). Different functional gene groups are color-coded. Variation in the GC content of the genome is shown in the middle circle. The map was drawn using OGDRAW version 1.2 (Lohse et al., 2007).

