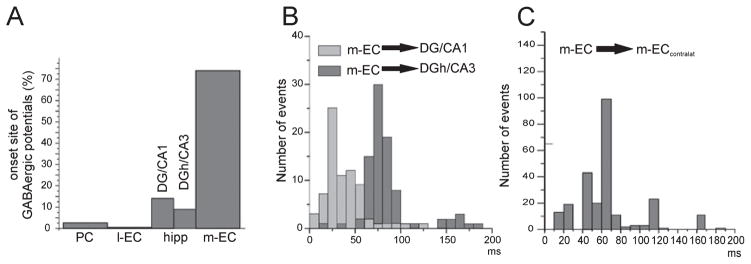
Fig. 6.
(A) Distribution histogram of the site of initiation of type 2 potential events in the PC, l-EC, hippocampus and m-EC. The hippocampus was subdivided into the DG / CA1 region and DG hilus (DGh) / CA3 region on the basis of the reconstructed position of the recording electrode. The analysis includes 528 events from nine experiments. (B) Distribution histogram of the onset delays of type 2 potentials originating in the m-EC and propagating to different portions of the hippocampus (DG / CA1 and DGh / CA3, respectively). (C) Distribution histogram of the onset delays of the type 2 potential originating in the m-EC and propagating to the contralateral m-EC.

