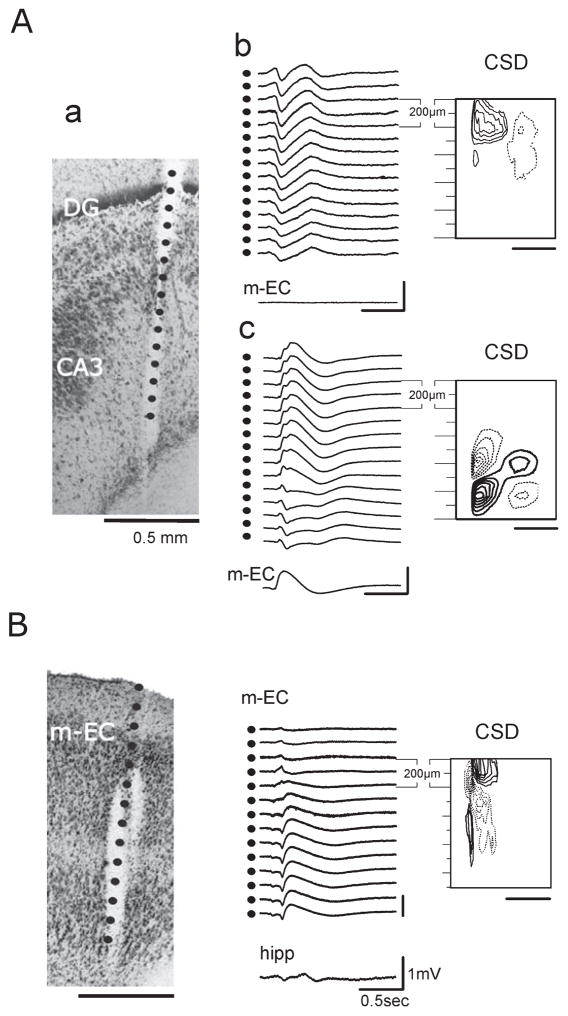
Fig. 7.
(A) Type 1 and type 2 potentials recorded from the same position with a recording silicon probe during one experiment. (a) The calculated position of the recording contacts is superimposed on the histological reconstruction of the track of the 16-channel silicon probe (100 μm separation between recording sites). Calibration bar: 500 μm. (b and c) Laminar profiles were recorded with the same probe position. (b) Field potential profile of type 1 potential recorded in the hilus of the DG as shown by the CSD contour plot (isocurrent lines at 0.01 mV / mm2). No activity was recorded with a glass electrode positioned in the m-EC. (c) Type 2 potential recorded in the hippocampus; the simultaneous activity in the m-EC is also illustrated. Corresponding CSD contour plot shows a local generation in CA3 (isocurrent lines at 0.05 mV / mm2). (B) Type 2 potential recorded in the m-EC. On the left is shown the reconstruction of the position of the multichannel probe (100 μm between recording sites) on the histological section (calibration bar: 500 μm). Field potential profile of the type 2 potential recorded in the m-EC and the trace simultaneously recorded in the hippocampus showing the propagation of the potential (represented in the middle). On the right, the relative CSD contour plot (isocurrent lines at 0.02 mV / mm2) shows an early sink in layer II–III (500–700 μm depth) followed by an associative sink in the superficial layers (0–200 μm depth).

