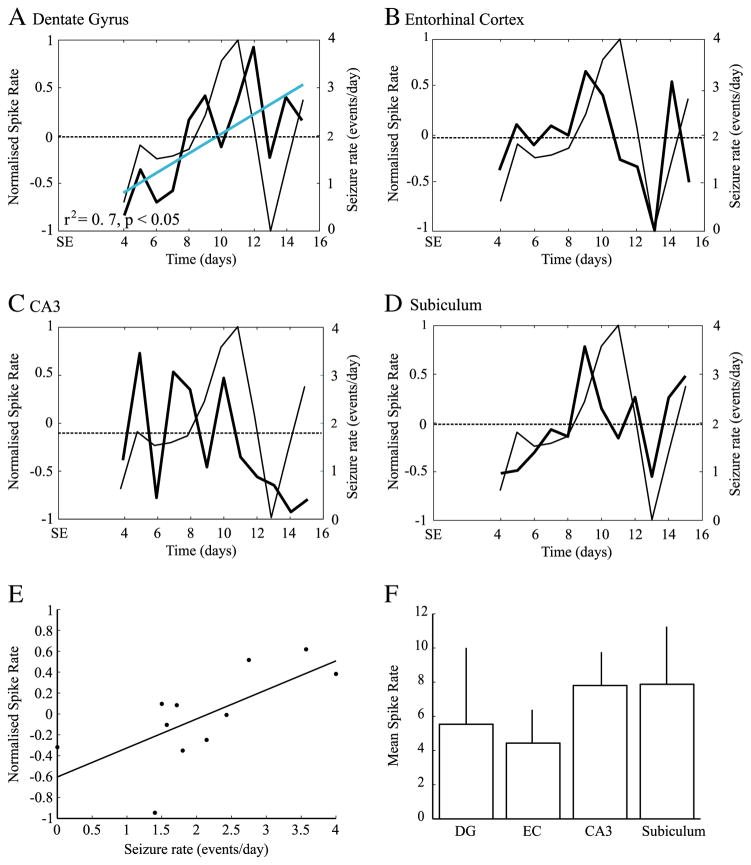
Fig. 3.
Average rates of all recorded interictal spikes as obtained from DG (A), EC (B), CA3 (C) and subiculum (D). thick lines represent the normalized rates of interictal spikes (left y-axis), while thin lines represent seizure rates (right y-axis). The dashed line represents the average interictal spike rate, from the 4th to the 15th day after SE. The blue solid line indicates a significant trend of interictal spike rates over time in the DG (A). E. scatter plot showing a significant relation between rates of interictal spikes in the EC and seizure rates, suggesting that interictal spike rates in this region can be used as a predictor of seizure rates on the following day (r2=0.4, p<0.05). F. Average interictal spike rates from all recorded sites; no significant differences were observed.

