Figure 1.
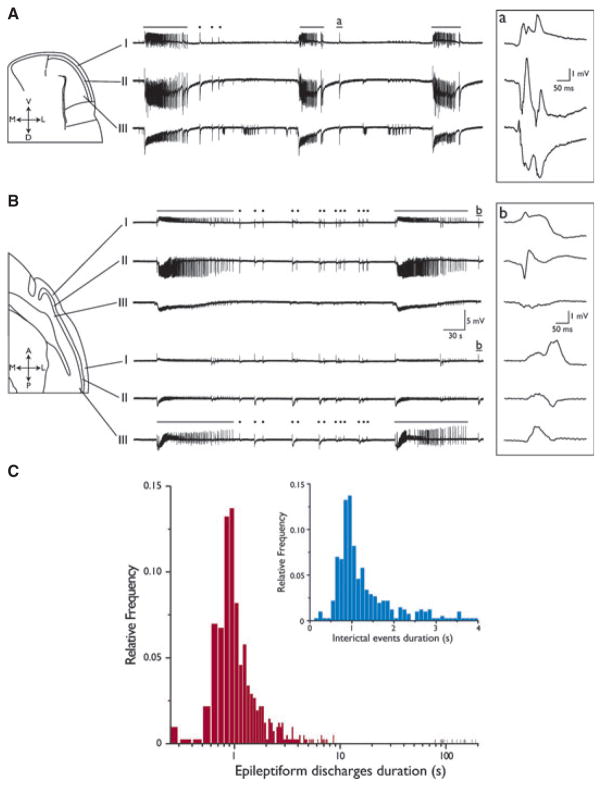
4AP-Induced epileptiform activity in PC coronal and sagittal slices. Field potential recordings from a coronal (A) and sagittal (B) PC slice. Electrodes were positioned in layers I, II, and III, as depicted in the slice schematics. Continuous superfusion with 4AP induced the generation of both ictal (solid lines) and interictal (dots) events. Boxed traces represent the interictal events indicated by insets a and b, shown at a faster time scale. Note the reversion of signal polarity between superficial and deep layers. (C) Frequency distribution histograms of event duration plotted on a log scale, showing a segregation of interictal-like and ictal-like events. As further emphasized in the inset (expanded linear scale), the latter were defined as events lasting longer than 2.5 s.

