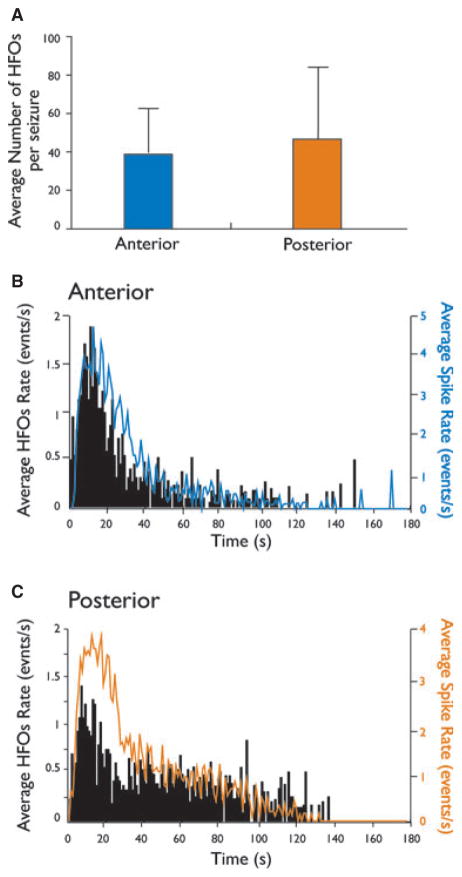
Figure 4.
Time distribution patterns of high-frequency activity during ictal discharges. (A) Bar graph showing the average number of events in the 80–200 Hz range during ictal discharges in the anterior and posterior regions of the piriform cortex in four slices, 22 ictal events. (B and C) Bar histograms showing the average rates of HFO events and the frequency of spikes occurring during ictal activity for the anterior and posterior regions of the PC. In both subregions, high-frequency activity was observed during the initial phase of ictal discharges.

