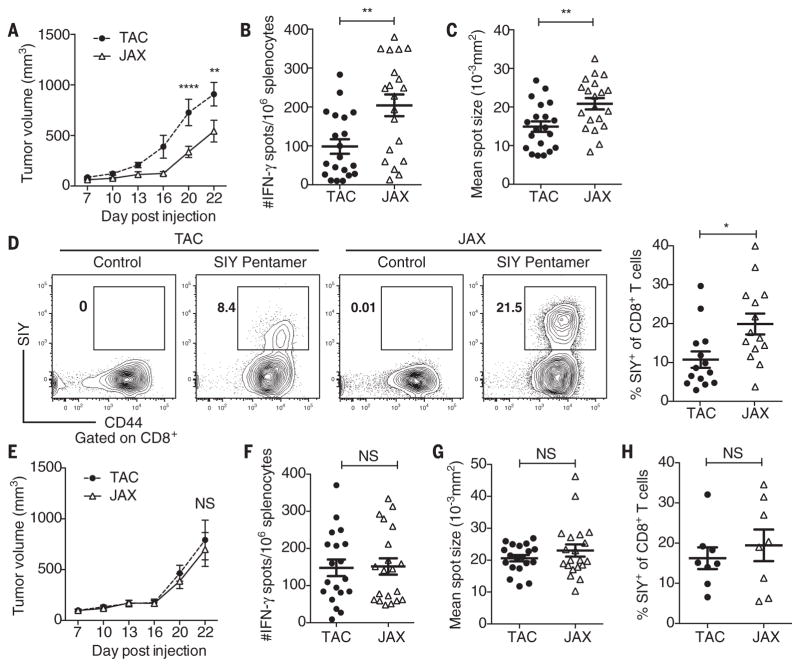
Fig. 1. Differences in melanoma outgrowth and tumor-specific immune responses between C57BL/6 JAX and TAC mice are eliminated when mice are cohoused.
(A) B16. SIY tumor growth kinetics in newly arrived JAX and TAC mice. (B) IFN-γ enzyme-linked immunospot assay (ELISPOT) in tumor-bearing JAX and TAC mice 7 days after tumor inoculation. (C) Mean size of IFN-γ spots (10−3 mm2). (D) Percentage of SIY+ T cells of total CD8+ T cells within the tumor of JAX and TAC mice as determined by flow cytometry 21 days after tumor inoculation. Representative plots (left), quantification (right). (E) B16.SIY tumor growth kinetics in JAX and TAC mice cohoused for 3 weeks before tumor inoculation. (F) Number of IFN-γ spots/106 splenocytes in tumor-bearing JAX and TAC mice cohoused for 3 weeks before tumor inoculation. (G) Mean size of IFN-γ spots (10−3 mm2). (H) Percentage of SIY+ T cells of total CD8+ T cells within the tumor of JAX and TAC mice cohoused for 3 weeks before tumor inoculation. Means ± SEM combined from six independent experiments, analyzed by two-way analysis of variance (ANOVA) with Sidak’s correction for multiple comparisons (A) and (E), or individual mice with means ± SEM combined from four (B), (C), (F), (G) or three (D) and (H) independent experiments, analyzed by Student’s t test; five mice per group per experiment; *P < 0.005, **P < 0.01; NS, not significant.

