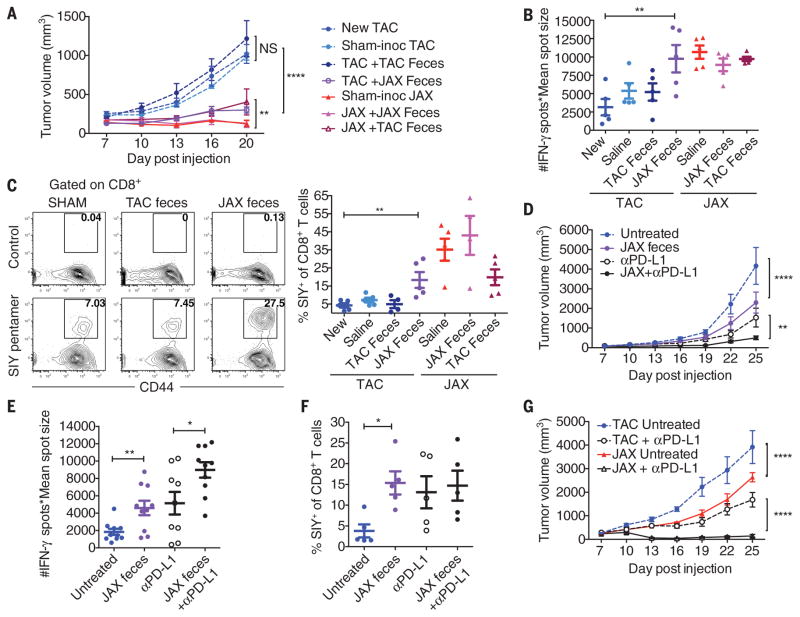
Fig. 2. Oral administration of JAX fecal material to TAC mice enhances spontaneous antitumor immunity and response to αPD-L1 mAb therapy.
(A) B16.SIY tumor growth in newly arrived TAC mice, TAC and JAX mice orally gavaged with phosphate-buffered saline or TAC or JAX fecal material before tumor implantation. (B) Number of IFN-γ spots × mean spot size (10−3 mm2), determined by ELISPOT 7 days after tumor inoculation. (C) Percentage of SIY+ CD8+ Tcells within the tumor of TAC and JAX mice treated as in (A), 21 days after tumor inoculation. Representative plots (left), quantification (right). (D) B16.SIY tumor growth in TAC mice, untreated or treated with JAX fecal material 7 and 14 days after tumor implantation, αPD-L1 mAb 7, 10, 13, and 16 days after tumor implantation, or both regimens. (E) IFN-γ ELISPOT assessed 5 days after start of treatment. (F) Percentage of tumor-infiltrating SIY+ CD8+ Tcells, determined by flow cytometry 14 days after start of treatment. (G) B16.SIY tumor growth kinetics in TAC and JAX mice, untreated or treated with αPD-L1 mAb 7, 10, 13, and 16 days after tumor implantation. Means ± SEM analyzed by two-way analysis of variance (ANOVA) with Dunnett’s (A) or Tukey’s (D) and (G) correction for multiple comparisons; or individual mice with means ± SEM analyzed by one-way ANOVA with Holm-Sidak correction for multiple comparisons (B), (C), (E), and (F); data are representative of (A) to (C), (F), and (G) or combined from (D) and (E) two to four independent experiments; five mice per group per experiment; *P < 0.05, **P < 0.01, ****P < 0.0001; NS, not significant.

