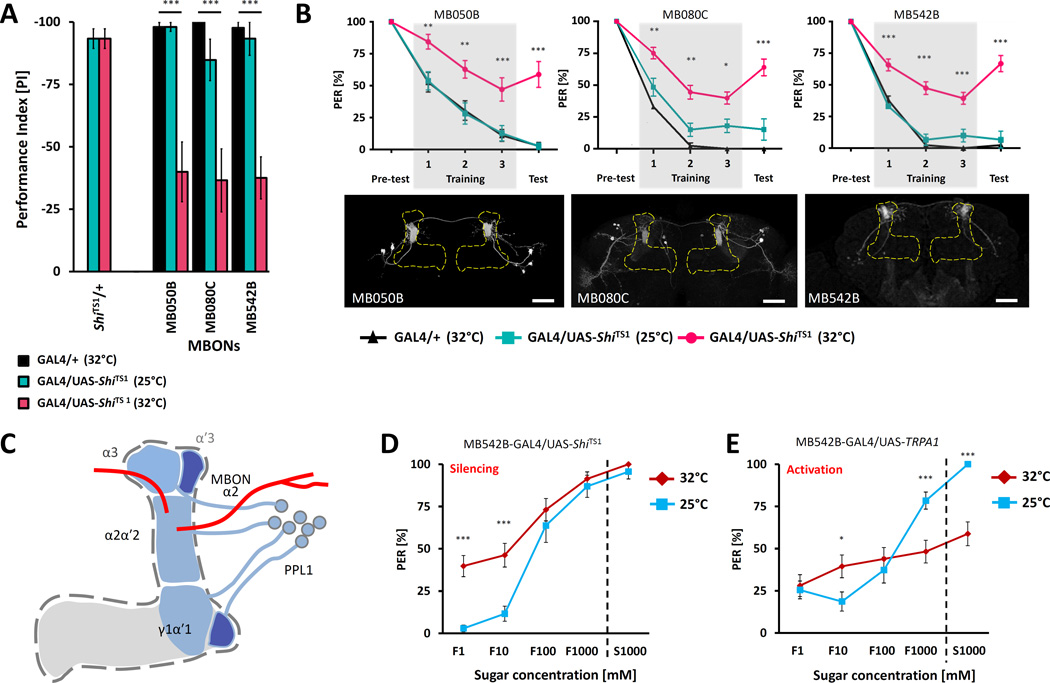
Figure 4. The α2 MB output neurons modulate naïve sugar response.
A) Average PER suppression reveals impaired memory in flies expressing ShiTS1 in α2 MBONs at 32°C (pink) compared to controls harboring Split-GAL4 constructs alone (black) or tested at 25°C (cyan) (n=10–36). B) Three independent lines that label the α2 MBONs disrupt taste memory when used to express ShiTS1 and tested at non-permissive temperature of 32°C (red). MB050B (n=12–17), MB080C (n=11–36), MB542B (n=10–33). Lower panels: Innervation patterns of the identified MBONs lines visualized with pJFRC225-5xUAS-IVS-myr::smGFP-FLAG reporter in VK00005. Scale bar represents 20µm. C) Possible pathway regulating aversive taste conditioning. Identified DANs of PPL1 cluster projects regions of vertical lobes of MBs including α2 and α3. MBONs projecting from the α2 region of MBs to dorsal region of the lateral horn (MB080C and MB050B) or to superior medial protocerebrum (MB542B). D) Flies expressing ShiTS1 in the identified output neurons (MB542B) blocks activity of these neurons at a restrictive temperature of 32°C (red) and leads to increase preference to low sugar concentrations compared to measurement at permissive temperature of 25°C (blue)(n=23–31). E) Flies expressing TRPA1 in the same output neurons (MB542B) reduce their PER response to high concentrations of sugars upon activation of TRPA1 (red) at an elevated temperature of 32°C compared to control measured at a low temperature of 25°C (blue)(n=34–38). All data represent the mean ± SEM * p<0.05, ** p<0.01, *** p<0.001

