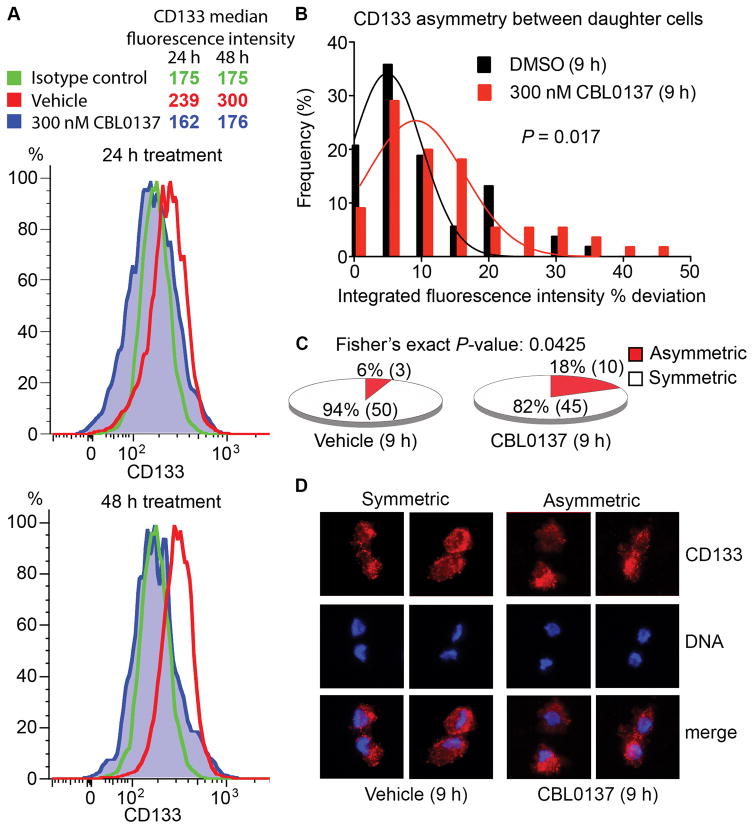
Figure 5. Acute exposure to CBL0137 decreases CD133 cell-surface expression and increases asymmetric cell division in GSCs.
A, GSCs in suspension were treated with DMSO or 300 nM CBL0137 for 24 or 48 h, and then stained with DAPI, isotype control or an anti-CD133-PE antibody. CD133 expression was subsequently analyzed by FACS within the DAPI-negative populations. B, Following release from 15 h of thymidine block, GSCs were treated with DMSO or 300 nM CBL0137 for 9 h. The histograms of the frequency distribution of the % deviation of CD133 staining (Integrated fluorescence intensities, IFI) between daughter cells in mitotic pairs in vehicle- (n=53) and drug-treated (n=55) are shown [one-tailed P-value with student’s t-test]. C, Fractions of symmetric vs. asymmetric distribution in the vehicle (50 vs. 3) and CBL0137 (45 vs. 10) group are represented as pie charts [frequency comparison with Fisher’s exact test]. Values above or below mean ± 2SD of the % deviation of CD133 fluorescence signals from the vehicle group (i.e., −24 to 25.2%) were used as the cutoff for asymmetric distribution. D, Representative fluorescence micrographs showing increased asymmetric distribution of CD133 staining in the CBL0137-treated cells compared to vehicle controls.

