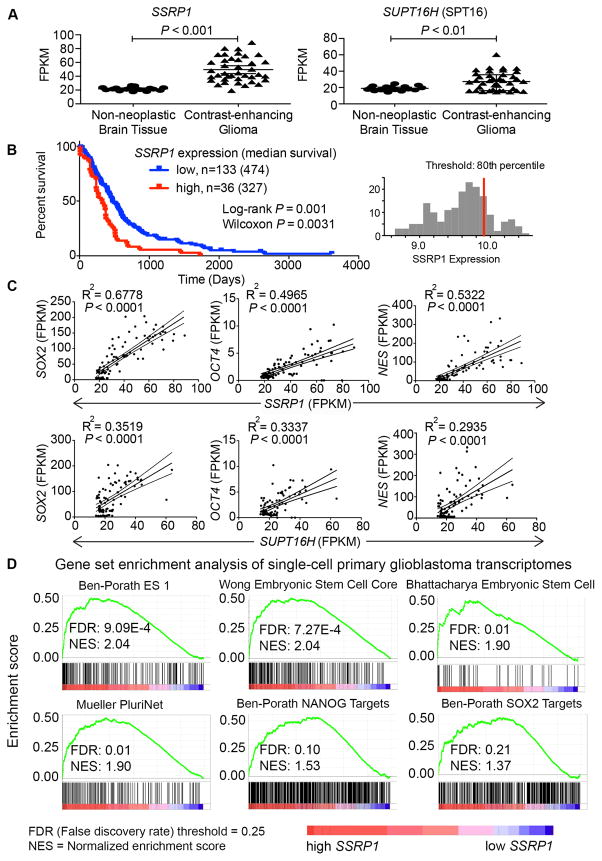
Figure 7. FACT is elevated in GBMs compared to normal brain tissues and its level correlates with survival and GSC gene signatures.
A, Normalized RNA expression levels in fragments per kilobase of transcript per million mapped reads (FPKM) of SSRP1 and SUPT16H were retrieved from GSE59612 (40) comparing their expression levels between contrast-enhancing glioma (n=39) versus non-neoplastic brain tissues (n=17) [unpaired Student’s t-test]. B, Kaplan-Meier survival plot of GBM patients with high (n=36) and low (n=133) expression of SSRP1 was downloaded from REMBRANDT (41). C, Expression levels (FPKM) of SOX2, OCT4, and NES were retrieved from RNA-seq data of contrast-enhancing glioma tissues (n=39) from GSE59612 and plotted against those of SSRP1 and SUPT16H [R2, regression coefficients; P values for linear regression]. D, Enrichment plots from GSEA for stem cell-related gene sets (false discovery rate, FDR ≤ 25%) in the primary single cell glioblastoma transcriptomes (GSE57872) expressing high SSRP1 (> 75 percentile, n=107) versus low SSRP1 (< 25 percentile, n=227).

