
Figure 3. sTNF exclusion averts MCA-induced MDSC accumulation.
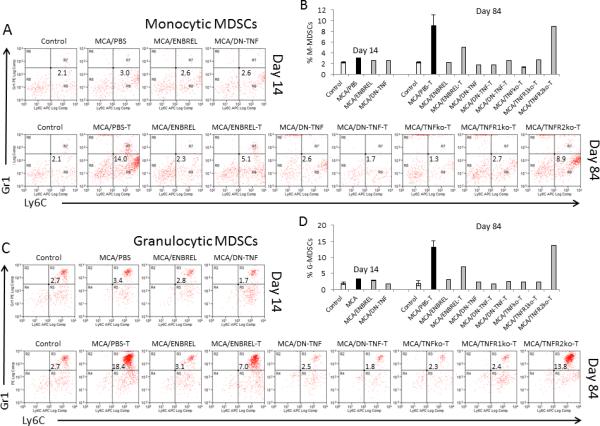
Similar experimental groups were set up as described in Fig. 1 legend. Both tumor-free and tumor-bearing (T) mice were examined: healthy/untreated control (Control); MCA-injected/PBS-treated (tumor-free:tumor-bearing: MCA/PBST), ENBREL-treated (tumor-free: MCA/ENBREL; tumor-bearing : MCA/ENBREL-T), XPro1595-treated (tumor-free: MCA/DN-TNF; tumor-bearing: MCA/DN-TNF-T); and/or tumor-bearing MCA-injected/TNFko (MCA/TNFko-T), TNFR1ko (MCA/TNFR1ko-T) and TNFR2ko-T (MCA/TNFR2ko-T) mice. Spleens were obtained from the listed groups of mice on days 14 (A, B) and/or 84 (C, D) following MCA injection, and stained with fluorochrome-conjugated antibodies to CD11b, Gr1, and Ly6C. Stained splenocytes were analyzed by three-color flow cytometry. The gating/analysis strategy is presented in Suppl. Fig. 1. CD11b+Gr1lo/−Ly6C+/hi monocytic MDSCs (A, B), and CD11b+Gr1hiLy6C+ granulocytic MDSCs (C, D) were scored. Dot-plot data present non-granular Gr1−Ly6C+CD11b+ (A), and granular Gr1+Ly6C+CD11b+ (C) cells. Histograms show individual and mean (2-3 replicates ± SD: Control, MCA/PBS-T and DN-TNF-T) percentages of monocytic (B) and granulocytic (D) MDSCs,.