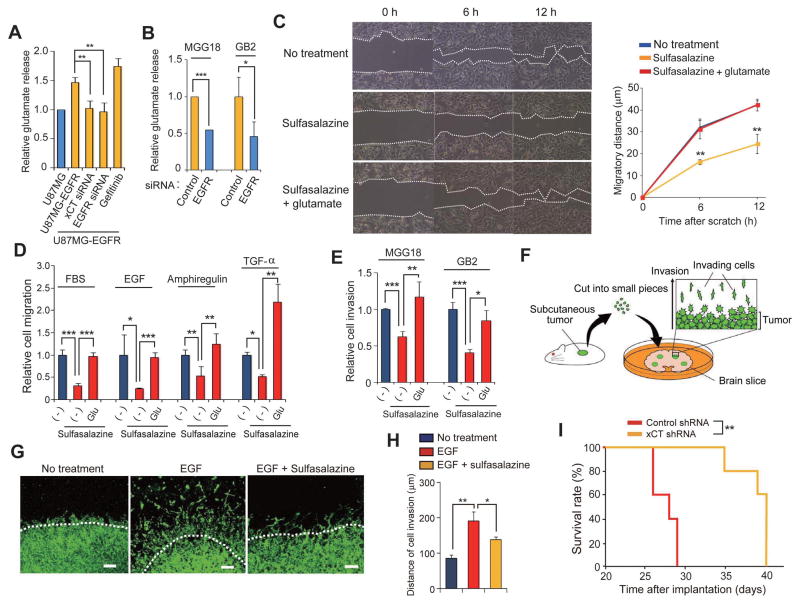
Figure 5. Glutamate release mediated by xCT promotes glioma cell migration.
(A) U87MG and U87MG-EGFR cells transfected (or not) with xCT or EGFR (#1) siRNAs were cultured in glutamate-free medium for 8 h in the absence or presence of 1 μM gefitinib, after which the culture supernatants were assayed for glutamate. Data are means ± SD from four independent experiments. **p < 0.01 (Student’s t test).
(B) MGG18 and GB2 cells transfected with control or EGFR (#1) siRNAs were cultured in glutamate-free medium for 8 h, after which the culture supernatants were assayed for glutamate. Data are means ± SD from four independent experiments. *p < 0.05, ***p < 0.001 (Student’s t test).
(C) T98G cells were subjected to a scratch assay in the absence or presence of 200 μM sulfasalazine or 250 μM glutamate for the indicated times and then imaged by phase-contrast microscopy (left panel). The migratory distances of the cells at each time point are presented as means ± SD from three independent experiments (right panel). **p < 0.01 versus the corresponding value for nontreated cells (Student’s t test).
(D) U87MG-EGFR cells were assayed for migration toward 5% FBS, EGF (10 ng/ml), Amphiregulin (20 ng/ml), or TGF-α (5 ng/ml) in the absence or presence of 200 μM sulfasalazine or 250 μM glutamate. Data are means ± SD from three independent experiments. *p < 0.05, **p < 0.01, ***p < 0.001 (Student’s t test).
(E) MGG18 and GB2 cells were assayed for matrix invasion toward 5% FBS in the absence or presence of 200 μM sulfasalazine or 250 μM glutamate. Data are means ± SD from three independent experiments. *p < 0.05, **p < 0.01, ***p < 0.001 (Student’s t test).
(F) Schematic representation of the organotypic brain slice culture system.
(G) Immunofluorescence analysis of human vimentin for detection of matrix-invading glioma cells in a mouse brain slice. Brain slices implanted with U87MG-EGFR tumor pieces were cultured for 14 days in the absence or presence of EGF (10 ng/ml) or 100 μM sulfasalazine. The white dashed lines indicate the edge of each tumor piece. Scale bars, 100 μm. (H) Quantification of matrix invasion determined as in (G). The distance between the edge of the tumor piece and the corresponding invasion front formed by the matrix-invading tumor cells was measured. Data are means ± SD from three independent experiments. *p < 0.05, **p < 0.01 (Student’s t test).
(I) Kaplan-Meier survival curves for mice with brain tumors derived from implanted U87MG-EGFR cells stably expressing control or xCT shRNAs (n = 5 for each group). **p < 0.01 (log-rank test).

