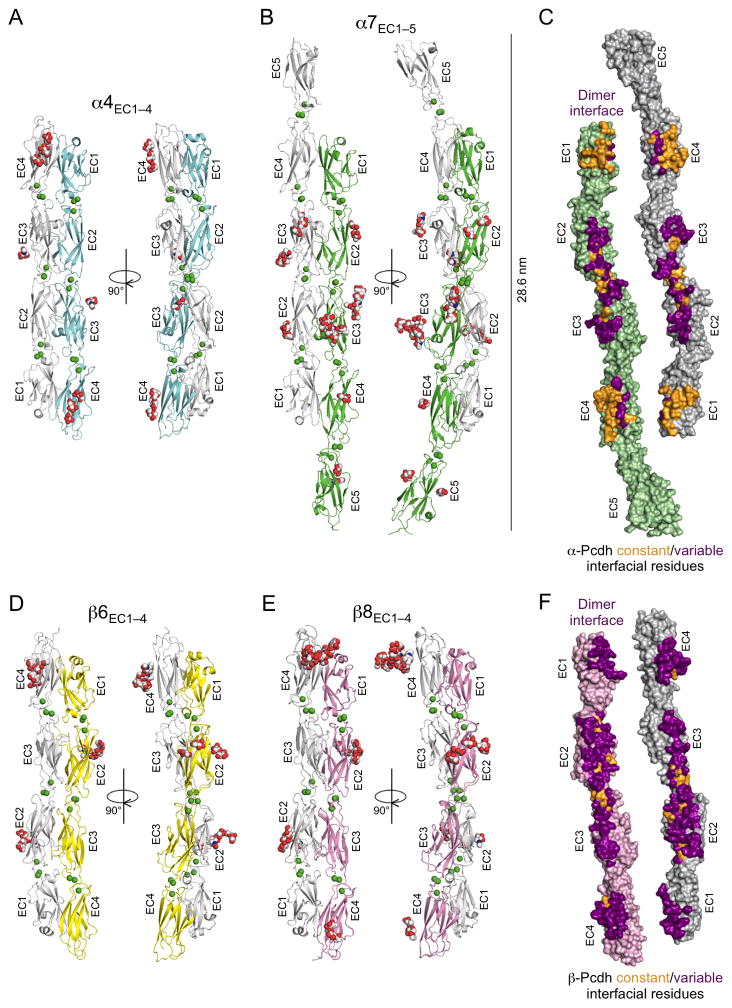
Figure 1. Crystal structures of the α- and β-Pcdh cell-cell recognition dimers.
A. Crystal structure of the α4EC1–4 dimer. The two EC1–4 protomers (colored cyan and grey) bind in a symmetrical anti-parallel configuration with EC1 interacting with EC4 and EC2 interacting with EC3. Bound calcium ions are shown as green spheres and glycans are shown as red, blue and white spheres.
B. The α7EC1–5 structure, protomers colored green and grey, shows a near identical EC1–4 mediated head-to-tail dimer to α4 (RMSD = 1.9 Å). The EC5 domains extend laterally, and are therefore not involved in the dimer interaction.
C. Surface representation of the two α7EC1–5 protomers, opened out to expose the dimer interface. Interfacial residues that are constant among α-Pcdhs are colored orange and those that vary among α-Pcdhs are colored purple. The interfacial residues are shown in detail in Figures 2 and 3.
D. The β6EC1–4 dimer, protomers colored yellow and grey, showing a similar EC1–4 mediated head-to-tail dimer to the α-Pcdh structures (RMSD to α4EC1–4 dimer = 4.7 Å).
E. The β8EC1–4 dimer (chains A and B from the crystal structure are shown), protomers colored pink and grey, is near identical to the β6EC1–4 dimer (RMSD = 1.6 Å)
F. Surface representation of the two β8EC1–4 protomers, opened out to expose the dimer interface. Interfacial residues that are constant among β-Pcdhs are colored orange and those that vary between β-Pcdhs are colored purple. The interfacial residues are shown in detail in Figures 2 and 4.
See also Figures S1–S3 and Tables S1–S4.

