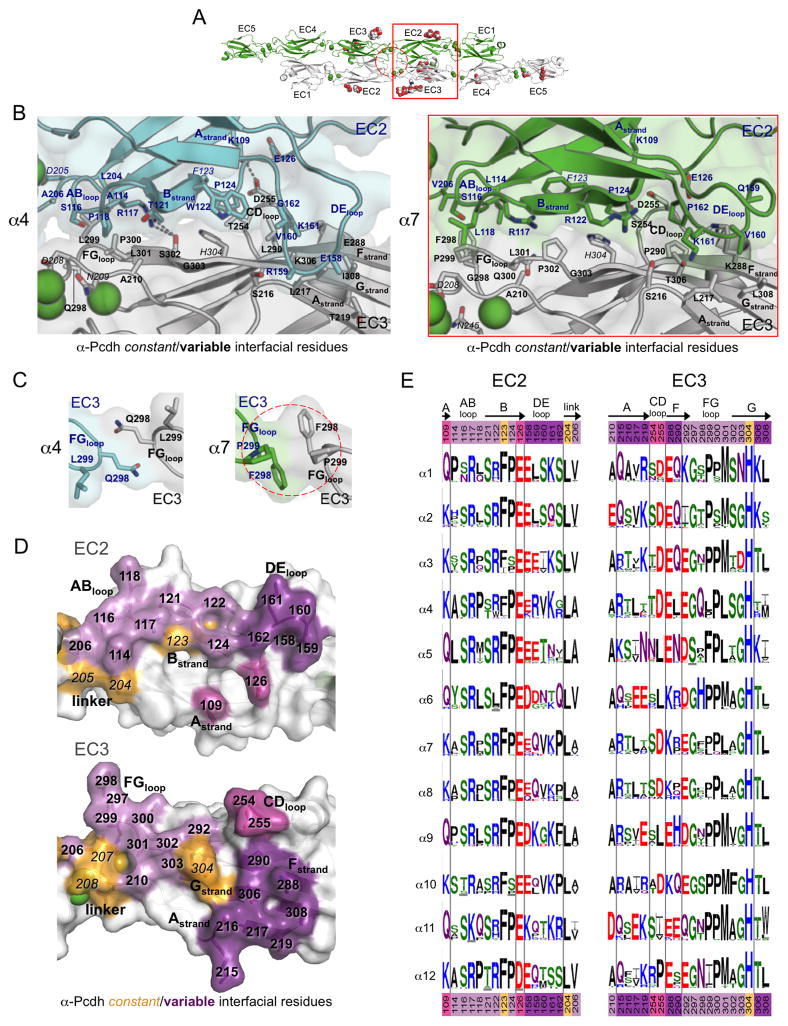
Figure 3. Diversity in the EC2:EC3 and EC3:EC3 interfaces of α-Pcdhs.
A. The α7EC1–5 dimer structure, with the EC2:EC3 interface (red box) and the EC3:EC3 interface (dashed red circle) highlighted.
B. Close-up view of the EC2:EC3 interface in α4EC1–4 (left, EC2 cyan, and EC3 grey) and α7EC1–5 structures (right, EC2 in green, EC3 in grey). Side chains are shown for all residues where the side chain contributes to the dimer interface. Bound calcium ions are shown as green spheres.
C. Close-up views of the EC3:EC3 interface in the α-Pcdh dimer structures. EC3 FG-loop residue 298 makes a symmetrical contact with itself in both the α4 (left, cyan and grey protomers) and α7 (right, green and grey protomers) dimers.
D. Surface representation of α7 EC2 and EC3 interfacial regions from an opened out dimer, highlighting the putative specificity-determining residues. Interfacial residues are colored orange if they are conserved amongst all α-Pcdh isoforms and shades of purple if they differ in one or more of the 12 α-Pcdhs. Matching shades of purple denote EC2 and EC3 interacting residues.
E. α-Pcdh sequence logos of EC2 and EC3 interface residues (species used are listed in Table S5). Secondary structure is indicated, and colors of residue numbers at top and bottom correspond to part (D).
See also Tables S4–S5.

