Figure 1.
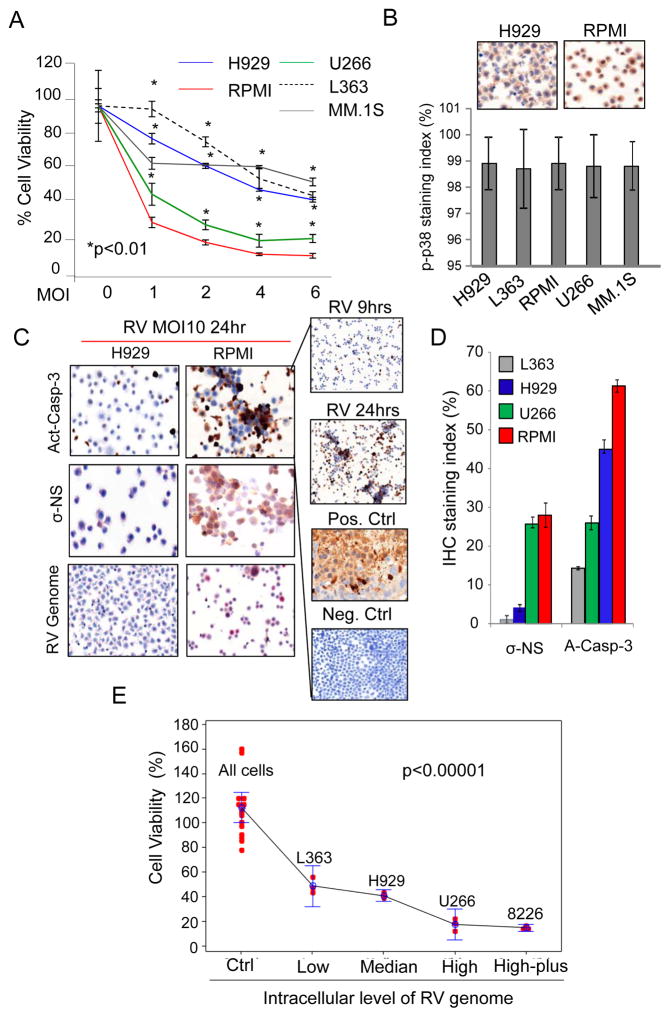
MM cell lines display differential sensitivities to RV. A) MM cell lines were treated for 48 hrs with RV at a multiplicity of infection (MOI) of 1, 2, 4, and 6, or PBS as a control (0). Proliferation was assessed by MTS assay. Graph represents results from three independent experiments with each treatment performed in triplicate. B) p-p38 MAPK expression in MM cell lines was determined by IHC. Images of H929 and RPMI are representative of other cell lines, which all have equivalent p-p38 activation upon RV infection as evaluated by the p-p38 staining index shown in the graph. C) MM cell lines were treated with RV at MOI 10 for 24 hours. The presence of the RV genome was detected by in ISH (bottom), while the levels of the RV protein σ-NS (middle) and activated caspase-3 (Act-Casp-3; top) were measured by IHC. Images of H929 and RPMI are representative for all MM cell lines tested. D) Caspase 3 activation RV σ-NS protein expression and RV genome following treatment of MM cell lines with RV at MOI 10 for 24 hours, as detected by IHC and ISH analysis. On the right panel activated Caspase-3 after 9hrs and 24hrs of RV infection. RPMI xenograft tumors treated (+Ctrl) with proteosome inhibitor (Velcade) or stained with not-selective IgG (-Ctrl) were used as positive and negative control respectively. E) MM cell lines (RPMI, U266, H929 and L-363) were treated for 3 and 9 hrs with RV at MOI10. Untreated cells were used as control (Ctrl). RV genome expression levels were assessed by q-RT-PCR and correlated with cell viability as assessed by Annexin V and propidium iodide staining after 48hrs of RV treatment. RV untreated MM cells are defined as All Cells. Data were divided into 5 groups based on the virus genome levels detected by q-RT-PCR (2−DCT): Low (< 5000 2−DCT); Median (< 100,000 2−DCT); High (<2,000,000 2−DCT); High-plus (>2,000,000 2−DCT). Data were presented by dots with 95% confidence interval of mean for each group, and each dot represents an observation. Slope analysis showed as the virus genome decreased, the percent alive cells decreases (slope=−2.26, p-value<0.0001).

