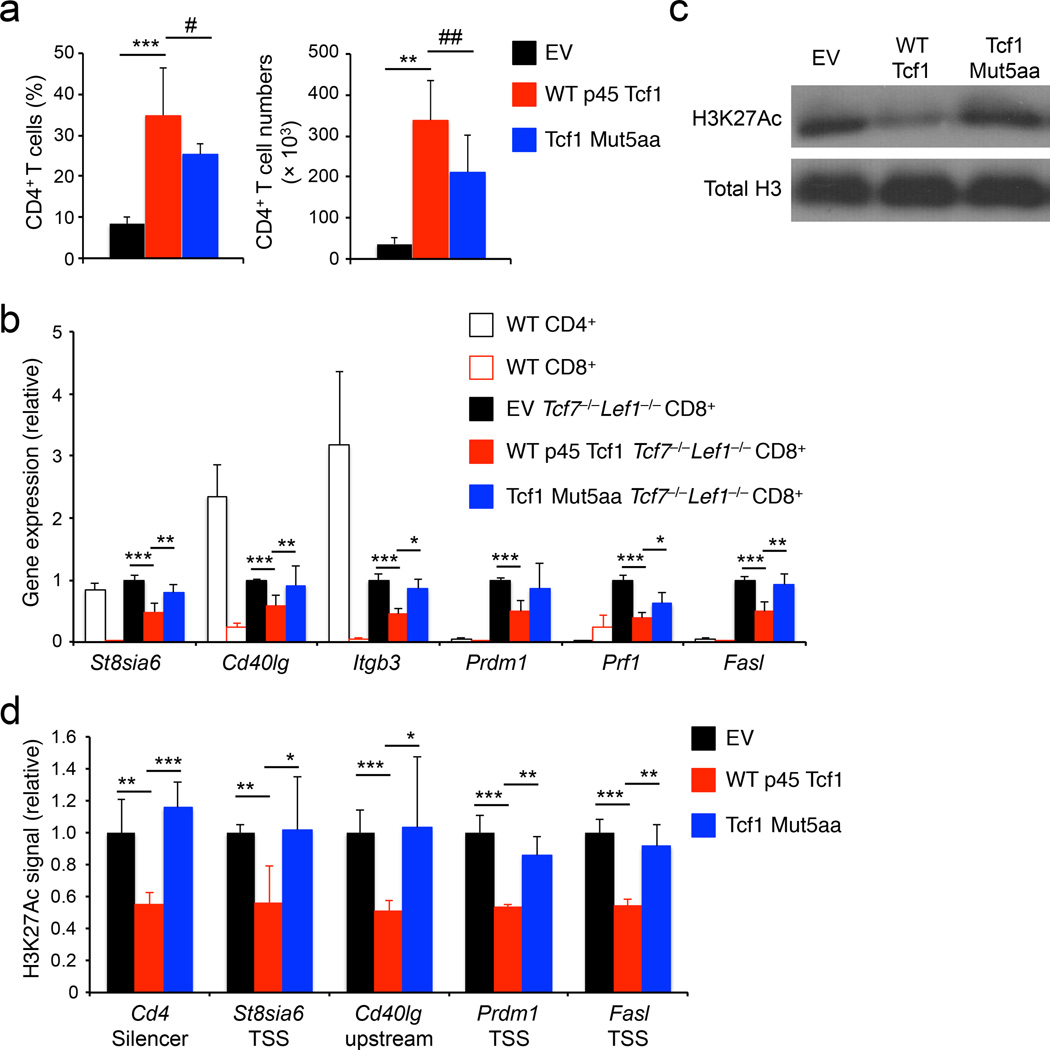
Figure 8. The Tcf1 HDAC activity is essential for establishing CD8+ T cell identity.
(a) Analysis of frequency (left) and numbers (right) of donor-derived CD45.2+GFP+TCRβ+CD4+ T cells in the spleens of BM chimeras that were reconstituted with Tcf7−/−Lef1−/− lineage-negative bond marrow cells retrovirally infected with empty vector (EV), WT p45 Tcf1, or Tcf1 Mut5aa retrovirus. (b) Quantitative RT-PCR analysis of gene expression (relative to Hprt) in wild-type (WT) splenic CD4+ or CD8+ T cells, splenic CD45.2+GFP+TCRβ+CD8+ T cells sorted from the EV-, WT p45 Tcf1-, or Tcf1 Mut5aa-complemented Tcf7−/−Lef1−/− BM chimeras. For each gene, its expression in EV-complemented cells was set as 1, and that in other cell types was normalized accordingly. (c) Immunoblot analysis of H3K27Ac and total H3 histone in histone protein extracted from splenic CD45.2+GFP+TCRβ+ CD8+ T cells sorted from the EV-, WT p45 Tcf1-, or Tcf1 Mut5aa-complemented Tcf7−/−Lef1−/− BM chimeras. (d) ChIP-qPCR analysis of relative H3K27Ac signals at select gene loci in splenic CD45.2+GFP+TCRβ+CD8+ T cells sorted from EV-, WT p45 Tcf1-, or Tcf1 Mut5aa-complemented Tcf7−/−Lef1−/− BM chimeras. For each gene locus, the relative H3K27Ac signal in EV-complemented cells was set as 1, and that in other cell types was normalized accordingly. Data are from 3 experiments (a, b, means ± s.d., n = 4–5), or representative from 3 experiments (c), or from 2 experiments with each sample measured in duplicates (d, means ± s.d.). #, p = 0.11; ##, p = 0.06; *, p<0.05; **, p<0.01; ***, p<0.001 for indicated comparisons, by Student’s t-test.

