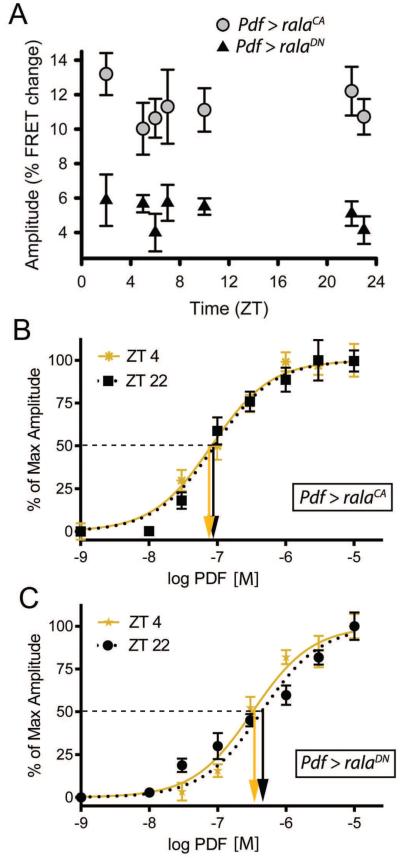
Figure 4. Manipulation of RalA activity in M pacemaker neurons affects their daily cycle of PDF sensitivity.
A. FRET responses to a single dose of PDF (10−07 M) at different times of day in two different genotypes: PDF > ralaCA, (grey circles; n = 21 brains with 62 ROIs analyzed) and Pdf > ralaDN (n = 24 brains with 84 ROIs analyzed). B. Concentration-effect curves for PDF sensitivity following expression of ralaCA in PDF neurons at ZT4 (gold) and ZT22 (black). C: Concentration-effect curves for PDF sensitivity following expression of ralaDN in PDF neurons at ZT4 (gold) and ZT22 (black). All genotypes contain UAS-Epac-camps. Downward arrows indicate values of EC50’s. At ZT4, the EC50 for ralaCA is not significantly different from control EC50 values (p =0.139), while the value for ralaDN is significantly different (p < 0.0001). At ZT22, the EC50 for ralaCA is significantly different from control EC50 values (p <0.0001), while the value for ralaDN is not significantly different (p = 0.133).

