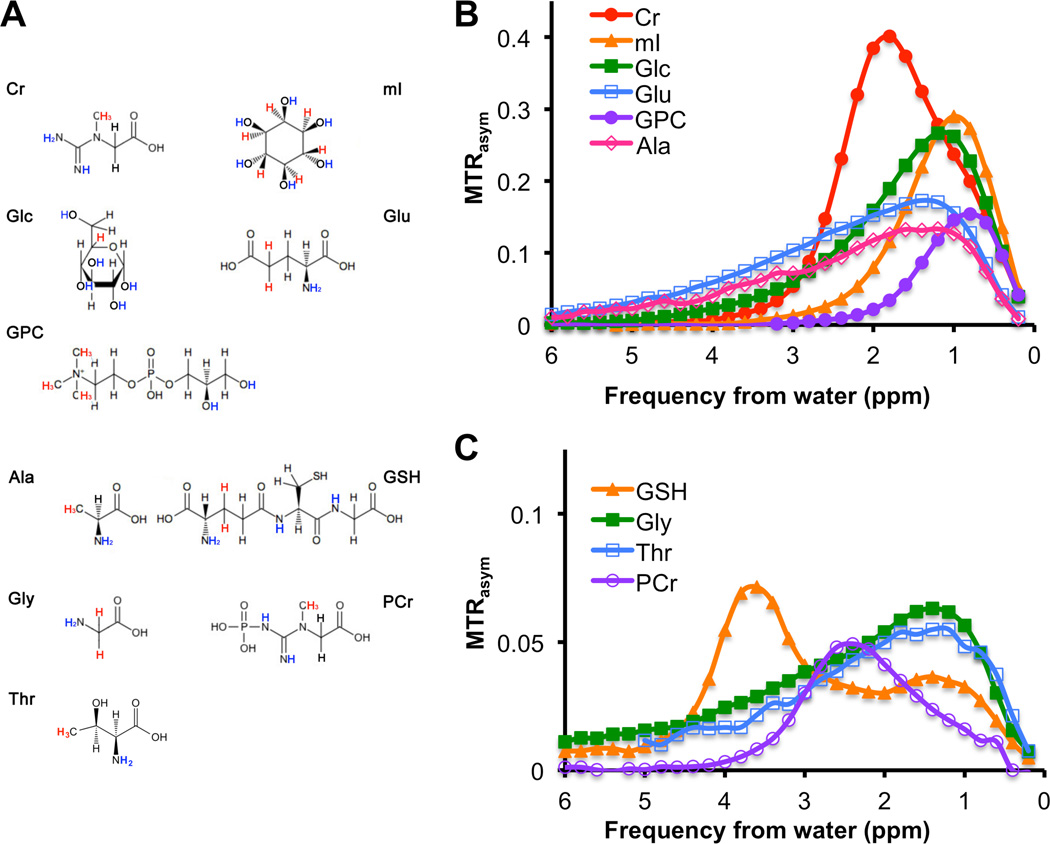
Figure 4.
CEST contrast as MTRasym,, and chemical structures of metabolites as detected in breast cell lines, which were measured at 20 mM, pH 7.3, and 37°C. (A) CEST-visible exchangeable protons of -OH, -NH-, and -NH2 groups are shown in blue and the protons used for the HR-MRS quantification are shown in red. (B) MTRasym of cellular metabolites with strong CEST contrast of MTRasym > 0.2 and intermediate CEST contrast of 0.1 < MTRasym < 0.2. (C) MTRasym of cellular metabolites with weak CEST contrast of MTRasym ≤ 0.1.

