Figure 5.
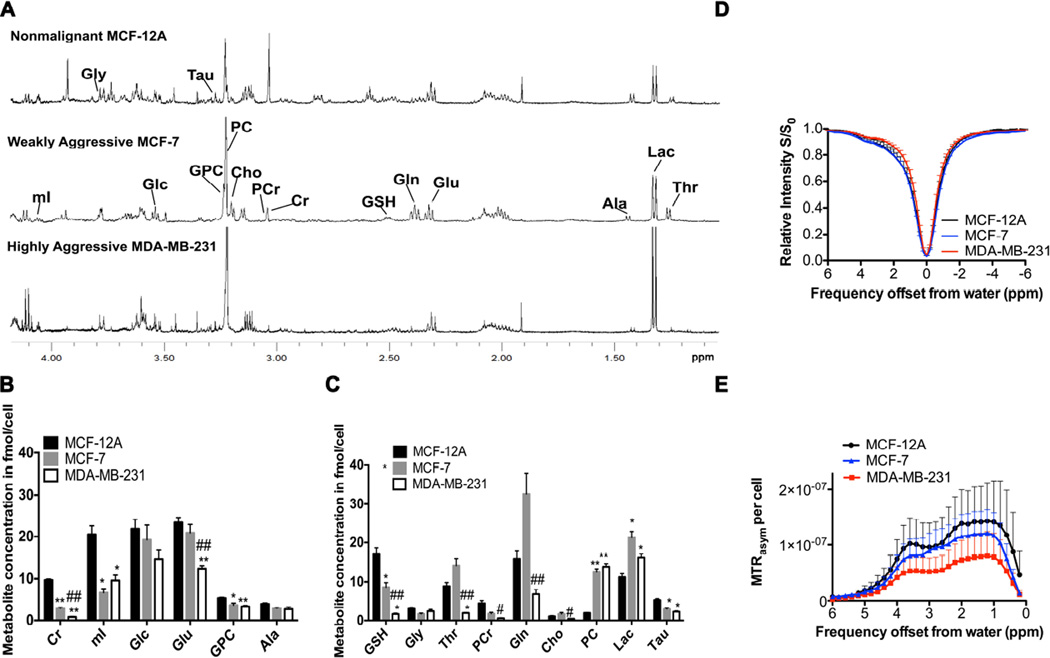
HR-MRS and CEST-MRI of human breast epithelial and breast cancer cell extracts. (A) HR-MR spectra of extracts from nonmalignant MCF-12A breast epithelial cells, weakly aggressive MCF-7 breast cancer cells, and highly aggressive MDA-MB-231 breast cancer cells. (B) HR-MRS quantification of metabolites with strong CEST contrast and (C) weak CEST contrast in water-soluble extracts from nonmalignant MCF-12A breast epithelial cells, and MCF-7 and MDA-MB-231 breast cancer cells (n=6 each). (D) CEST-MRI Z-spectra for the same cell extracts as in A–C. (E) CEST contrast in MTRasym per cell (n=6 each), with MCF-12A showing significantly (p=0.02) higher CEST contrast than MDA-MB-231. Values are mean ± standard error. * p < 0.05, ** p < 0.01 versus MCF-12A. # p < 0.05, ## p < 0.01 versus MCF-7.

