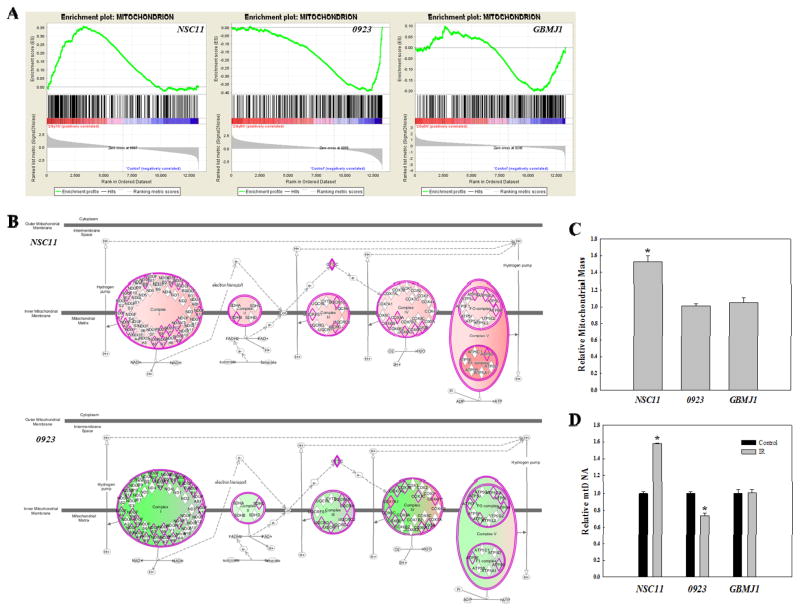
Figure 5.
Cell line-dependent IR-induced changes in mitochondria. (A) GSEA enrichment plots for the GO term Mitochondrion in each GSC line. (B) IPA canonical pathway for “Oxidative Phosphorylation”. Proteins outlined in pink are those inputted to IPA from the IR-induced translatome of the either NSC11 (top) or 0923 (bottom). Pink shading indicates predicted activation and green shading indicates predicted repression, with the intensity describing the level of activation/repression. (C) Relative mitochondrial mass at 24h after IR (2Gy). (D) Relative mitochondrial DNA content 24h after IR (2Gy) was determined by qPCR using mitochondrial cytochrome c oxidase subunit II (MT-CO2) normalized to genomic DNA content. Data are expressed as means ± SEM for 3 independent experiments. *p < 0.05 according to Student’s t-test (IR vs. control).

