
Figure 2.
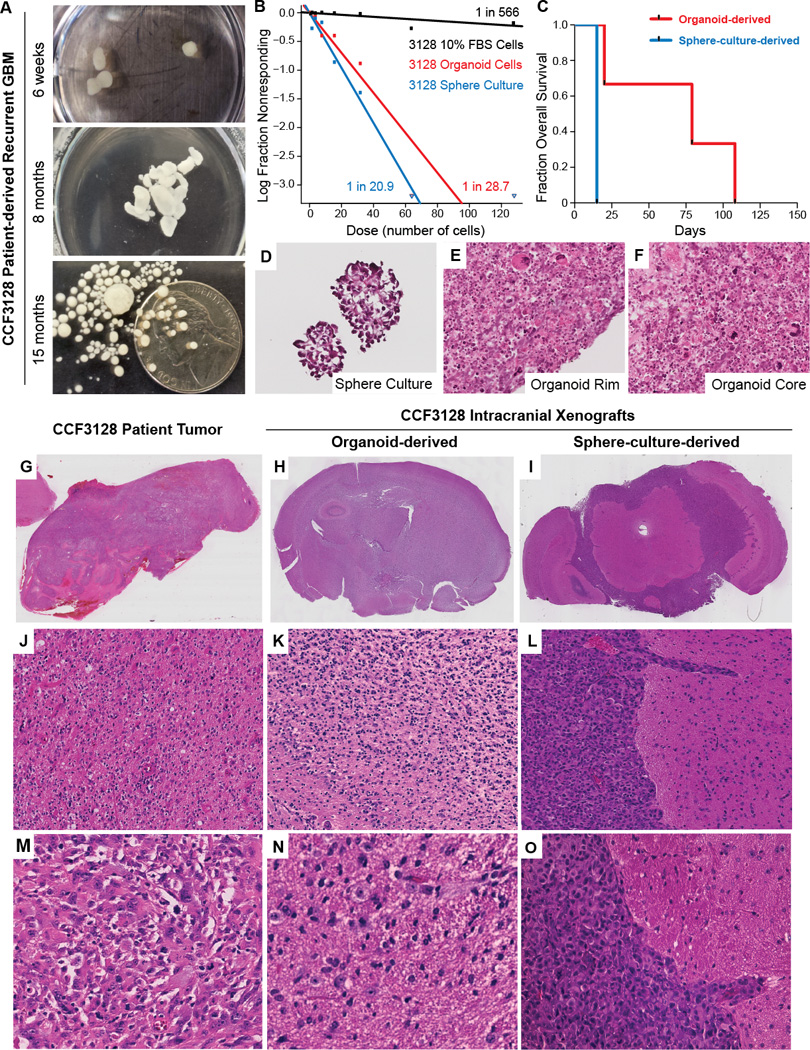
Organoid-derived glioblastoma xenografts recapitulate the diffusive phenotype of the original patient tumor. A, Longitudinal growth of CCF3128 patient-derived recurrent glioblastoma in organoid culture. B, Limiting dilution assays of organoid, tumorsphere, or FBS-differentiated CCF3128 cells. Sphere-forming cell frequencies are indicated next to each line. C, Survival plot of mice following orthotopic injection of 50,000 dissociated CCF3128 organoid or tumorsphere cells. D–F, High power micrographs of tumorsphere or organoid frozen sections (H&E, 40×). G, Low power micrograph of biopsy sample (H&E, 1×). H, Whole mount mouse brain bearing organoid derived xenograft demonstrating effacement of ventricles and asymmetric expansion of cerebral hemispheres with no clear margins of tumor (H&E, 1×). I, Whole mount mouse brain bearing tumorsphere derived xenograft showing solid growth pattern in subarachnoid space and clear margins of tumor/brain interface. (H&E, 1×). J, Intermediate power micrograph of patient biopsy specimen exhibiting a diffuse growth pattern of tumor cells with eosinophilic cytoplasm (H&E, 10×). K, Intermediate power micrograph of organoid derived xenografted tissue showing a diffuse growth pattern of tumor cells with eosinophilic cytoplasm and irregularly shaped nuclei (H&E, 10×). L, Intermediate power micrograph of tumorsphere-derived xenograft showing solid growth pattern, sharp tumor-brain interface with tumor cells growing down a the perivascular Virchow-Robin space (H&E, 10×). M, High power micrograph of patient biopsy tissue exhibiting variable amounts of eosinophilic cytoplasm with hyperchromatic irregular nuclei and pleomorphic cytoplasmic outlines (H&E, 40×). N, High power micrograph of organoid derived xenografted tissue exhibiting individual fibrillar tumor cells infiltrating into the brain substance as single cells with variable amounts of intervening brain parenchyma between the pleomorphic tumor cells (H&E, 40×). O, High power micrograph of tumorsphere-derived xenografted tissue showing solid growth pattern of basophilic tumor cells with high nuclear to cytoplasmic ratios that exhibit a sharp tumor-brain interface with infiltration along the perivascular Virchow Robin space (H&E, 40×).