
Figure 3.
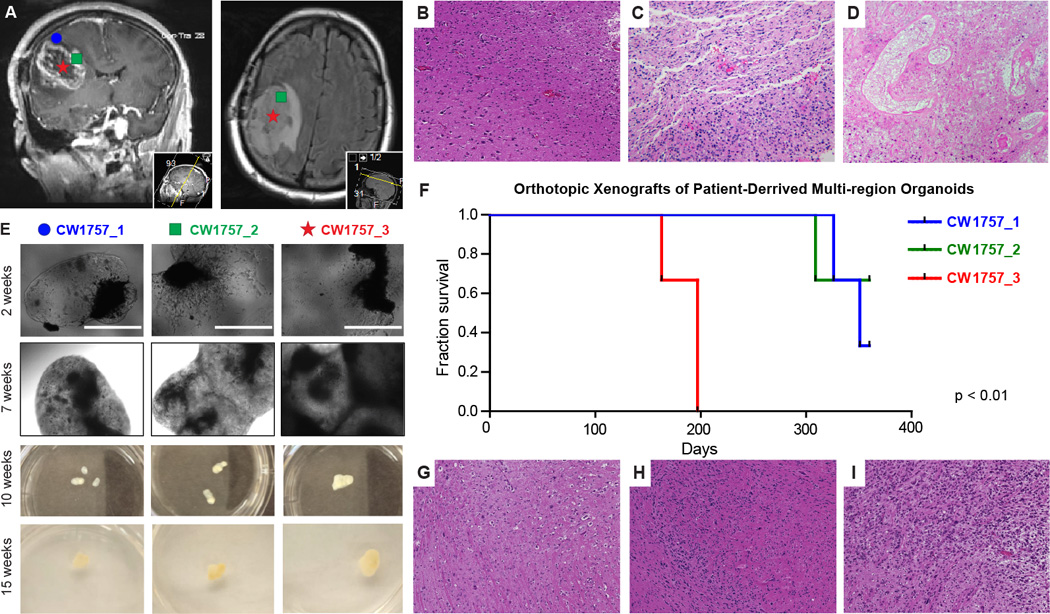
Patient-derived multi-region tumor samples. A, Based on preoperative MRI scans, surgical samples were selected from 3 distinct tumor regions for laboratory propagation. These regions were: CW1757_1 = Superficial Cortex ≥ 3mm from enhancing margin and also within hyperintense FLAIR; CW1757_2 = Enhancing margin of tumor; CW1757_3 = Tumor Center, Hypointense on T1 and non-enhancing (Typically associated with necrosis on IHC). B, High power micrograph of CW1757_1 patient derived biopsy tissue along the tumor-brain margin demonstrating mild increase in cellular density related to single cell infiltration of tumor cells (H&E, 40×). C, High power micrograph of CW1757_2 biopsy demonstrating markedly increased fibrillar tumor cellular density with variable amounts of intercellular eosinophilic brain parenchyma and no geographic necrosis (H&E, 40×). D, High power micrograph of CW1757_3 biopsy demonstrating regions of geographic necrosis (centrally) consistent with therapeutic effect rimmed by viable cells of unknown histology (H&E, 40×). E, CW1757_X specimens grown directly in organoid format for the indicated culture periods in 6-well plates, scale bar = 1000 µm. F, Kaplan-Meier survival analysis of mice bearing orthotopic xenografts from dissociated organoids originating from each tumor region in panel E. G, High power micrograph of organoid derived xenografted tumor tissue along the tumor-brain interface showing moderately increased cellular density and an indistinct tumor margin related to single cell infiltration of tumor cells into the surrounding brain, a feature also found in the biopsy tissue (B above) (H&E, 40×). H, High powered micrograph showing cellular density varying from moderate to high as detected by the variable amounts of basophilic nuclei and eosinophilic cytoplasm (H&E 40×). I, High power micrograph demonstrating a region of predominately high cellular density associated with hyperchromatic and pleomorphic basophilic nuclei, a region that differs markedly from the other regions of the tumor xenograft shown in G and H (H&E 40×).