
Figure 4.
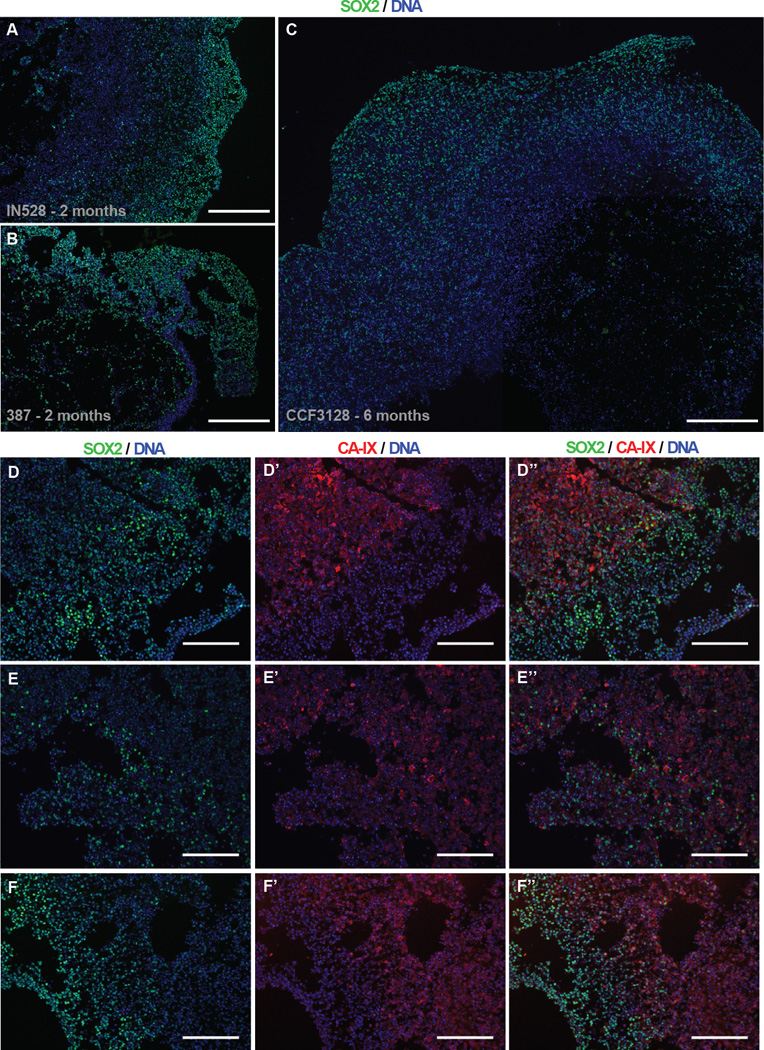
Inverse Gradients of Stem Cell Frequency and Hypoxia in Organoids. A–C, Wide field immunofluorescence imaging of nuclear SOX2 protein in IN528 (a), 387 (b), and CCF3128 (c, mosaic) organoids. Scale bars = 400 µm. D–F, Co-immunofluorescence of SOX2 and CA-IX near the edges of IN528 organoids. Scale bars = 200 µm.