
Figure 5.
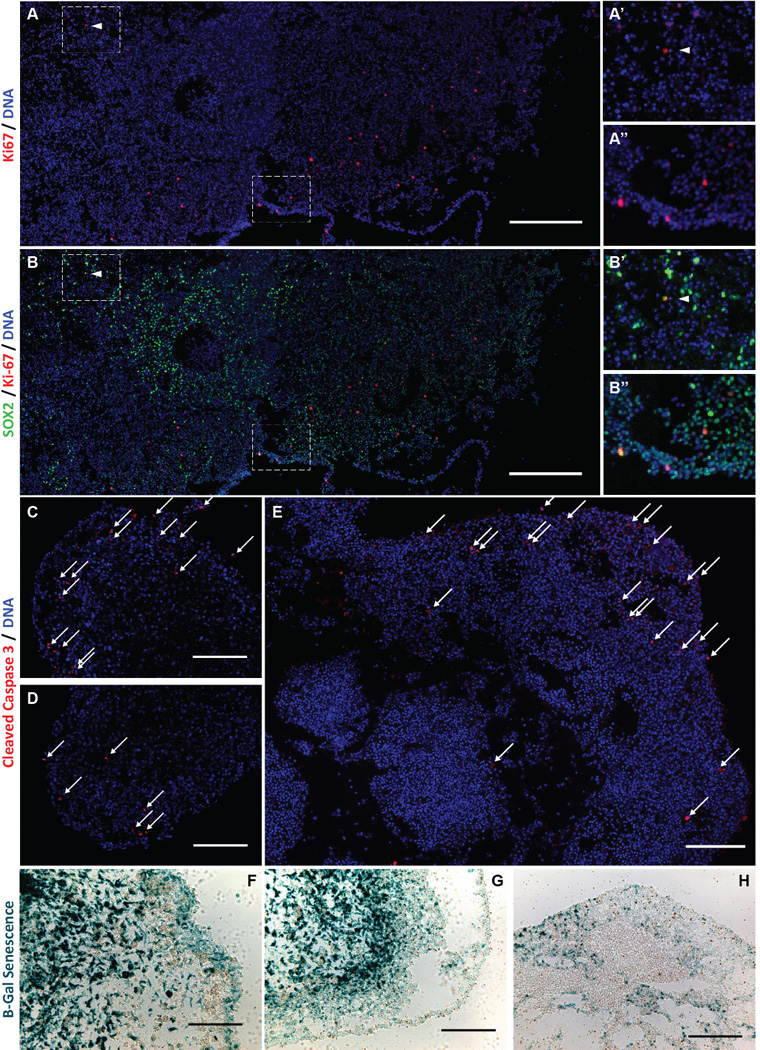
Spatial and phenotypic cellular heterogeneity in organoids. A, B, Immunofluorescence mosaic imaging of Ki-67 protein and SOX2 in IN528 organoids, scale bars = 400µ. Insets (A’–B”) are magnified regions of the mosaic span as indicated by dashed boxes. C–E, Immunofluorescence imaging specific to cleaved Caspase 3 protein in IN528 (C, D) and 387 (E) organoids. White arrows indicate positive cells, scale bars = 200µm. F–H, Light micrographs of X-Gal detection of Senesence-associated β-galactosidase in IN528 (F, G) and 387 (H) organoids. Scale bars = 100 µm (F), 200 µm (G), 400 µm (H).