
Figure 7.
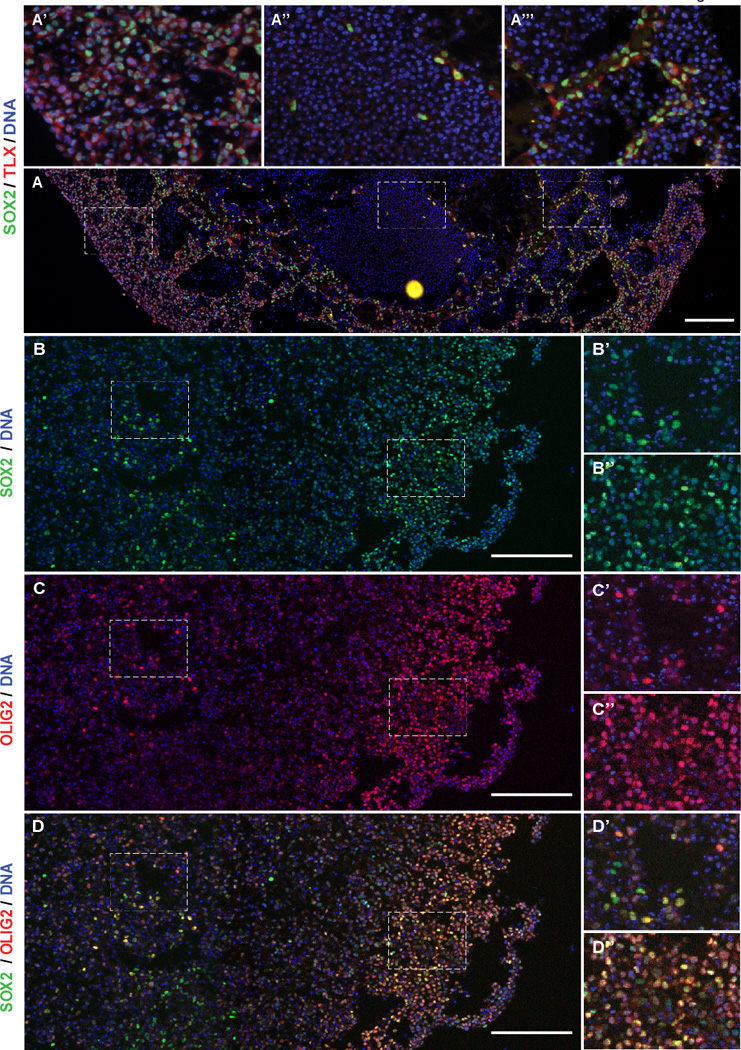
Partially overlapping stem cell marker expression in glioblastoma organoids. A, Immunofluorescence mosaic imaging of SOX2 and TLX protein in 387 organoids. Scale bars = 200 µm. Insets (a’–a’”) are magnified regions of the mosaic span as indicated by dashed boxes. B–D, Immunofluorescence mosaic imaging of SOX2 and OLIG2 protein expression in IN528 organoids. Insets (B’–D”) are magnified regions of the mosaic span as indicated by dashed boxes. Scale bars = 200 µm.